Start Using PagerDuty Today
Try PagerDuty free for 14 days — no credit card required.
resolve event will be sent to to the PagerDuty service to resolve the alert, and associated incident on that service.There are two ways that Datadog can be integrated with PagerDuty: via Global Event Routing or through an integration on a PagerDuty Service.
If you are adding Datadog to an existing PagerDuty service, please skip to the Integrating with a PagerDuty Service section of this guide.
Integrating with Global Event Routing enables you to route events to specific services based on the payload of the event from Datadog. If you would like to learn more, please visit our article on Rulesets.
1. From the Automation menu, select Event Rules and click your Default Global Ruleset.
2. On the Event Rules screen, click on the arrow next to Incoming Event Source to display the Integration key information. Copy your Integration Key. This is the same integration key you will use for any other tool you want to integrate with using event rules. When you have finished setting up the integration in Datadog, you will return to this interface to specify how to route events from Datadog to services in PagerDuty.
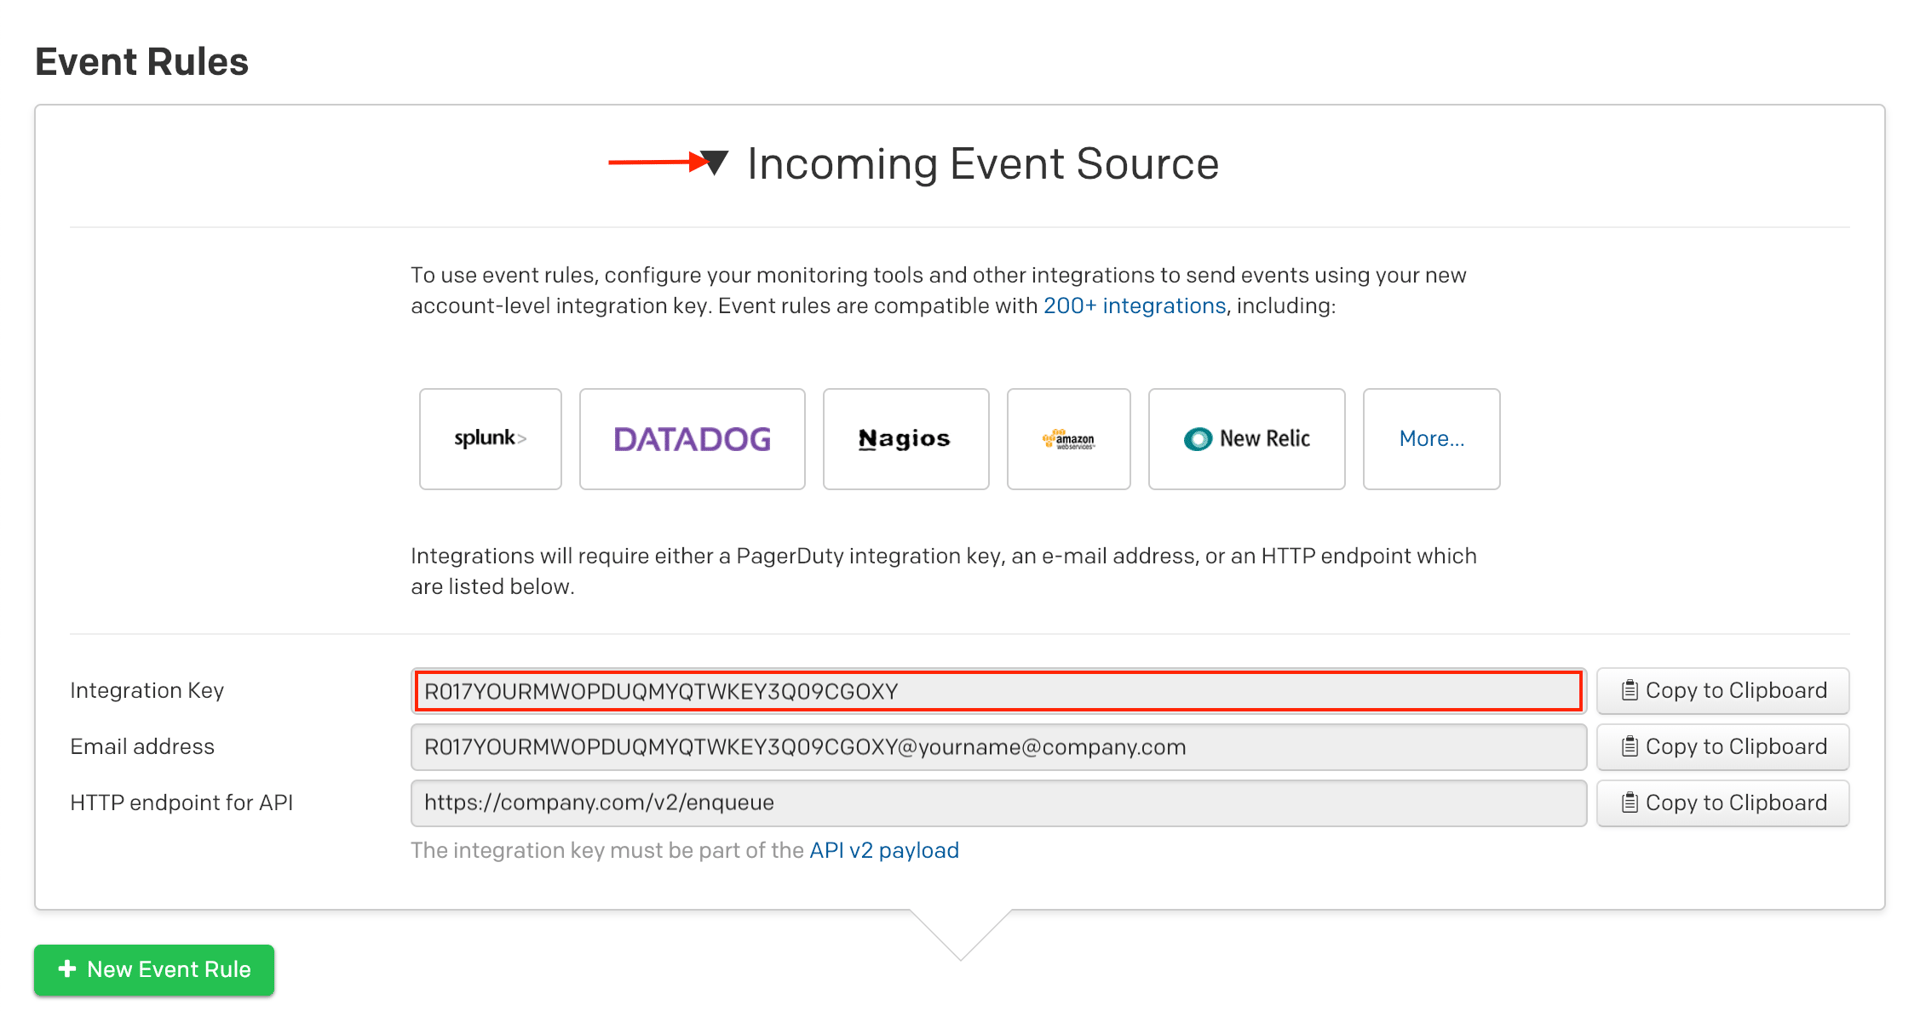
Keep this key in a safe place for later use. You can now proceed to the In Datadog section below.
Note: If your team has already integrated using event rules, you can verify by looking up the PagerDuty Event Rules Integration Key in Datadog’s integrations tab. You can then use the existing integration and pipe Datadog events into your service by writing new event rules for your service.
Integrating with a PagerDuty service directly can be beneficial if you don’t need to route alerts from Datadog to different responders based on the event payload. You can still use service-level event rules to perform actions such as suppressing non actionable alerts and adjusting the severity.
1. From the Services menu, select Service Directory.
2. If you are adding your integration to an existing service, click the name of the service you want to add the integration to. Then select the Integrations tab and click the Add an integration.
If you are creating a new service for your integration, please read our documentation in section Configuring Services and Integrations and follow the steps outlined in the Create a New Service section, selecting Datadog as the Integration Type in step 4. Continue with the In Datadog section (below) once you have finished these steps.
3. Select Datadog from the Integration Type menu.
4. Click Add to save your new integration. You will be redirected to the Integrations tab for your service.
5. Find your integration in the list and click the ∨ to the right. The Integration Key generated here will here will be used when you configure the integration with Datadog in the next section.
If you have already installed Datadog, please skip to step 6.
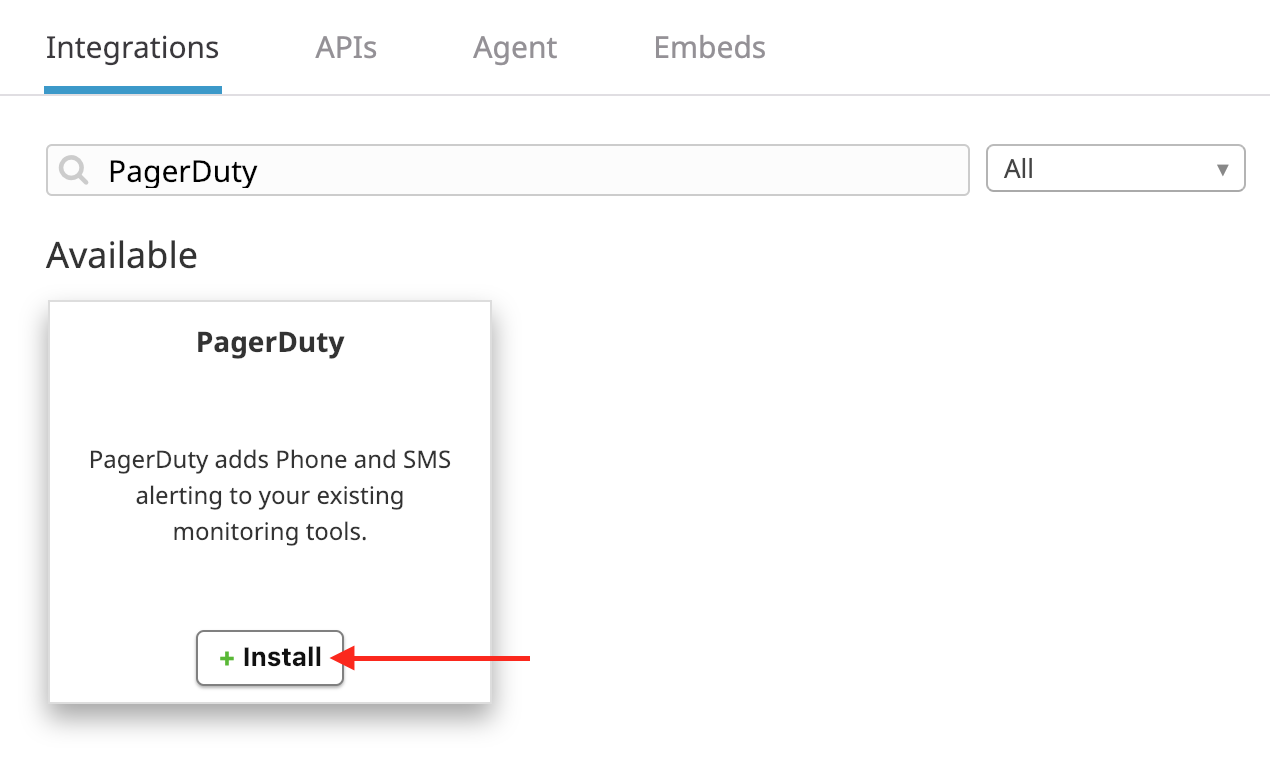
1. In your Datadog account, navigate to the Integrations menu bar and click Integrations.
2. Search for PagerDuty and hover over the icon to click Install.
3. On the PagerDuty Integration screen, select the Configuration tab and then click Alert with PagerDuty.
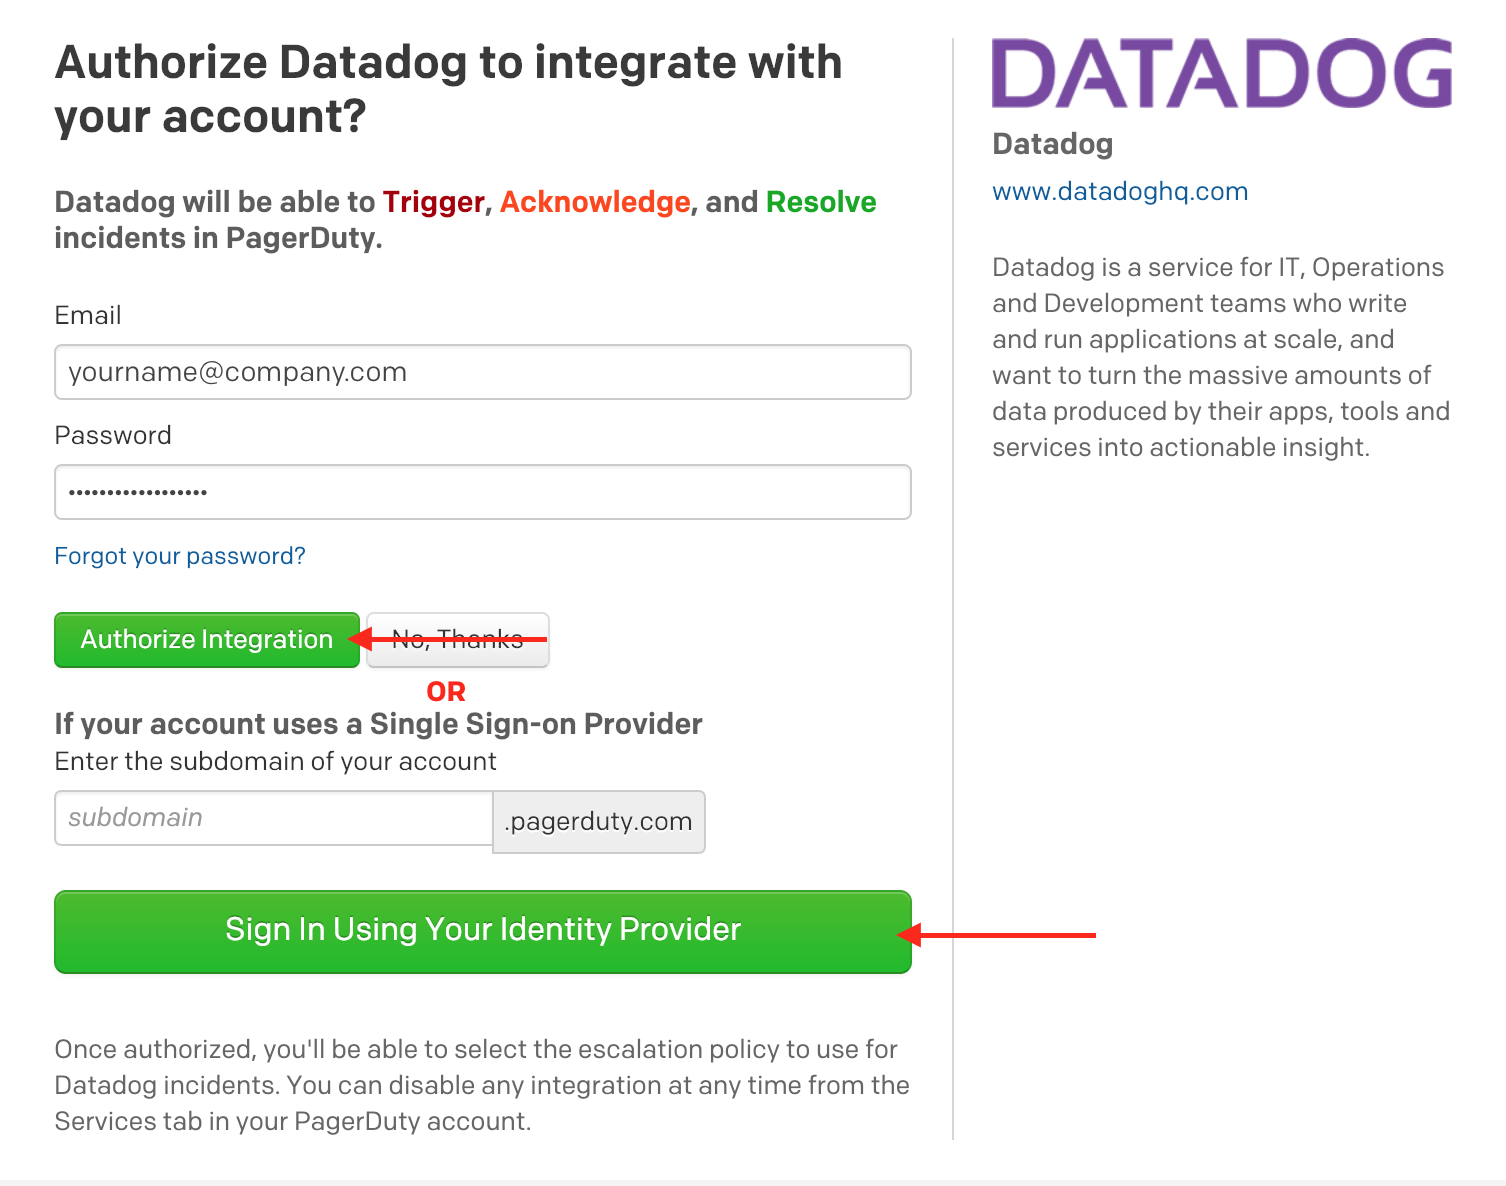
4. You will be redirected to a PagerDuty authorization screen. There are two ways to authorize the integration:
a. Enter your PagerDuty login information and click Authorize Integration.
b. If your account uses a single sign-on provider, enter your subdomain and click Sign-In Using Your Identity Provider.
5. On the next screen, you will be given multiple options that correlate with how you are integrating:
a. If you are Integrating with a PagerDuty Service: select Use an integration on an existing service and select your service from the dropdown menu.
b. If you are Integrating with Global Event Routing: select Create a new service with an integration for Datadog. Enter a placeholder Service name and Escalation policy—this service and all of its settings will be replaced by your Global Event Routing Integration key in step 6 (below).
c. Once you’ve made your selection, click Finish Integration.
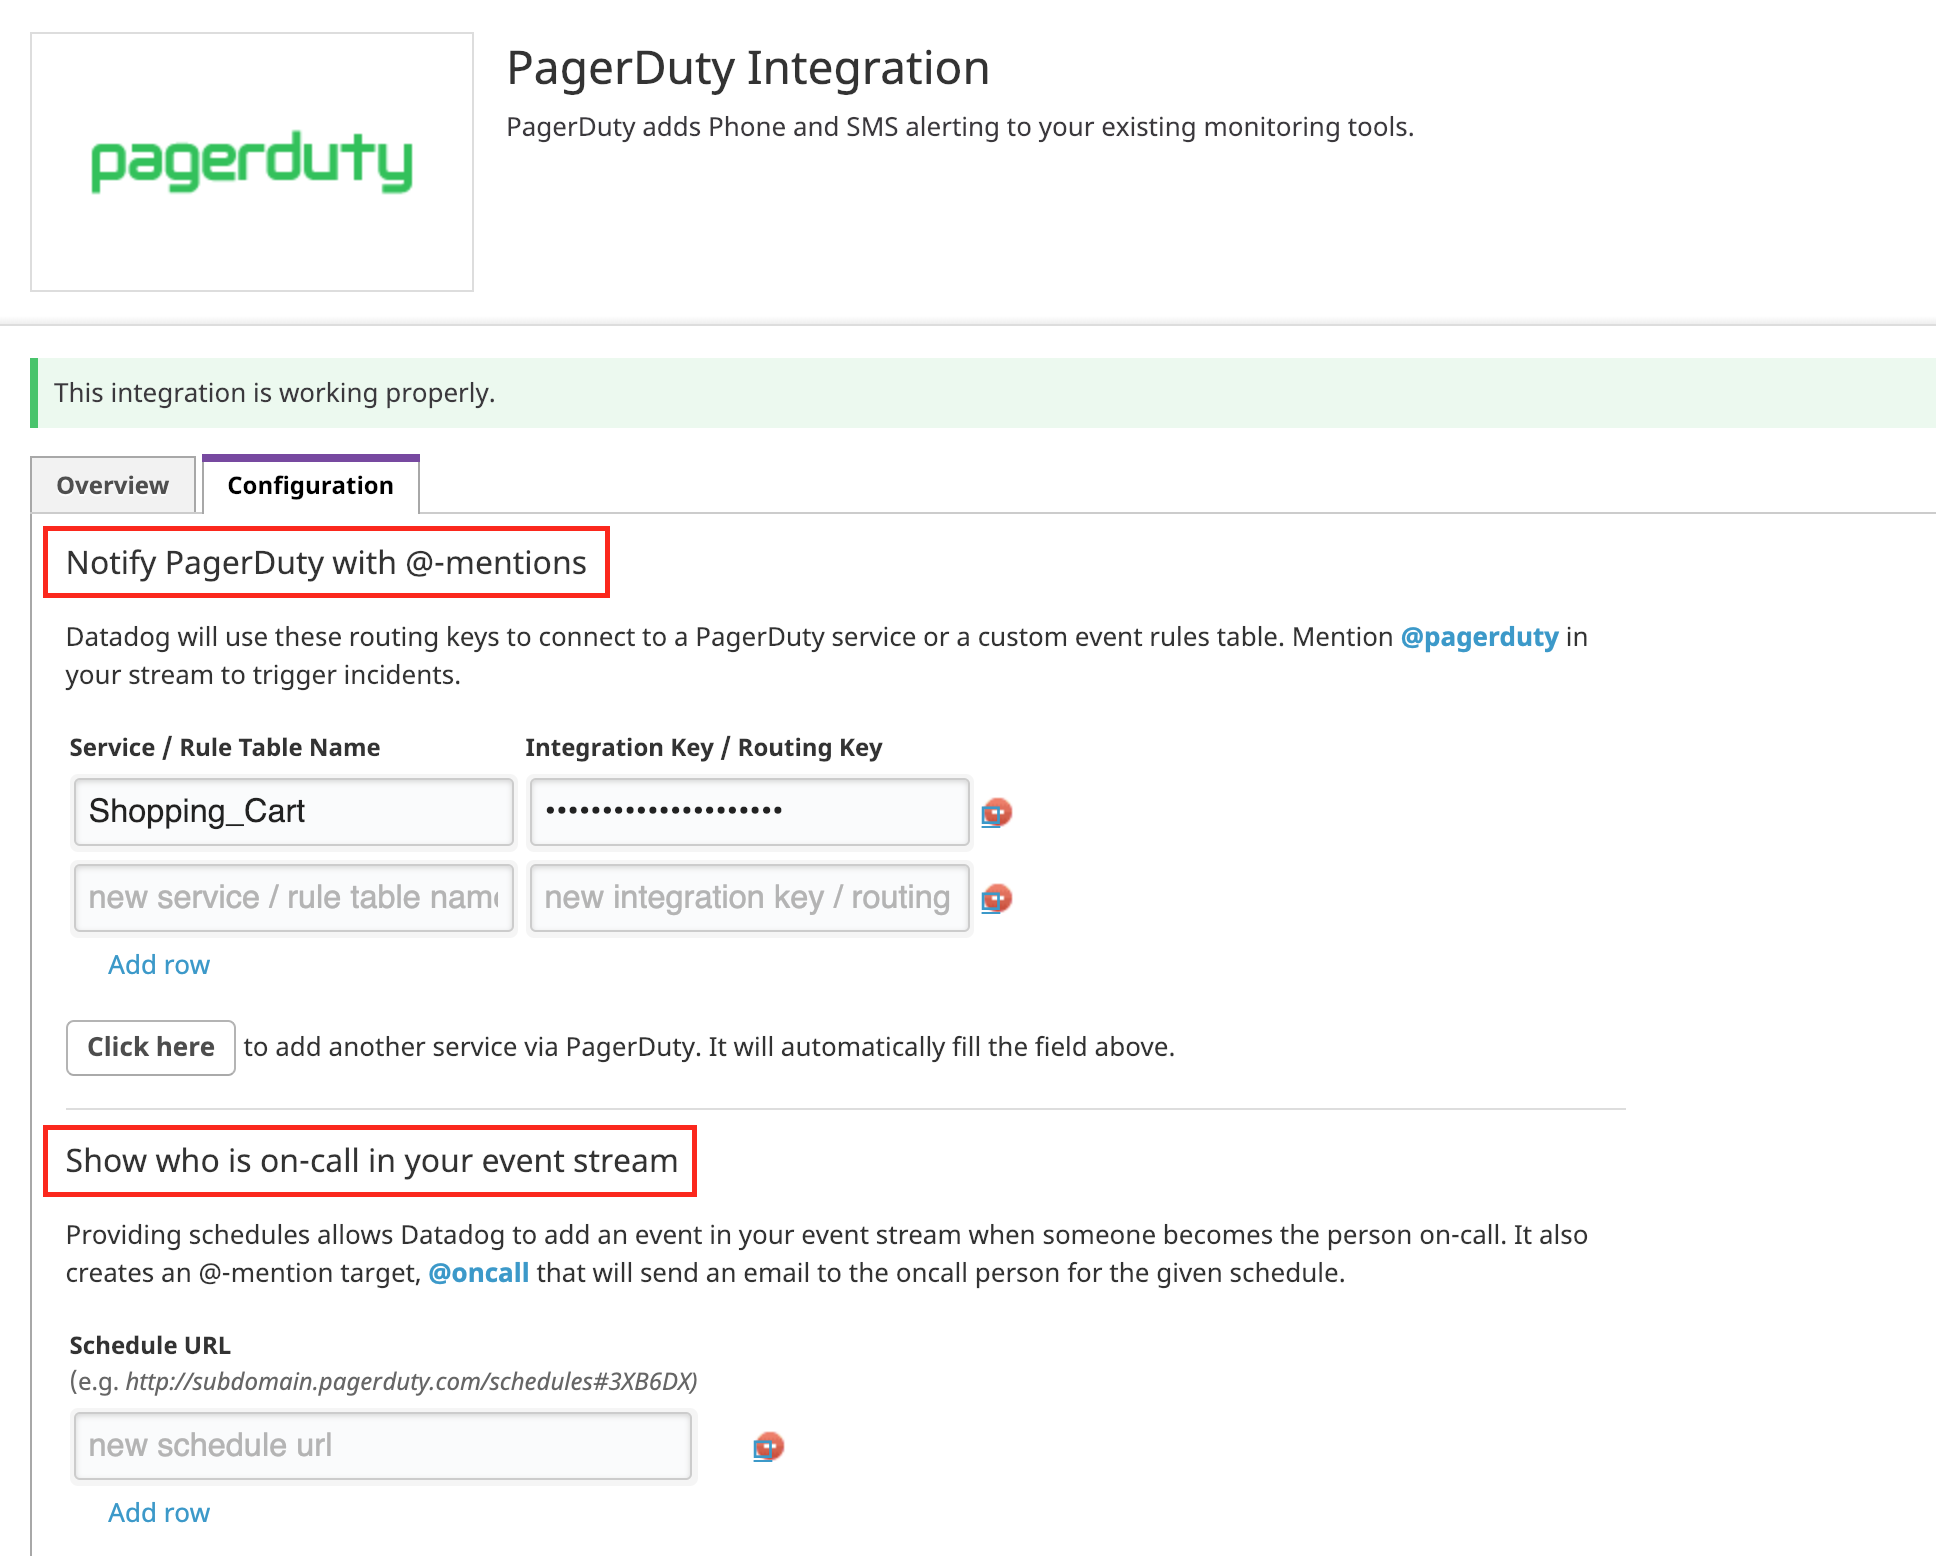
6. You will be redirected back to the PagerDuty Integration screen in Datadog and your new integration will be authorized. On this screen you will have multiple options to correlate incidents in PagerDuty services with Datadog metrics:
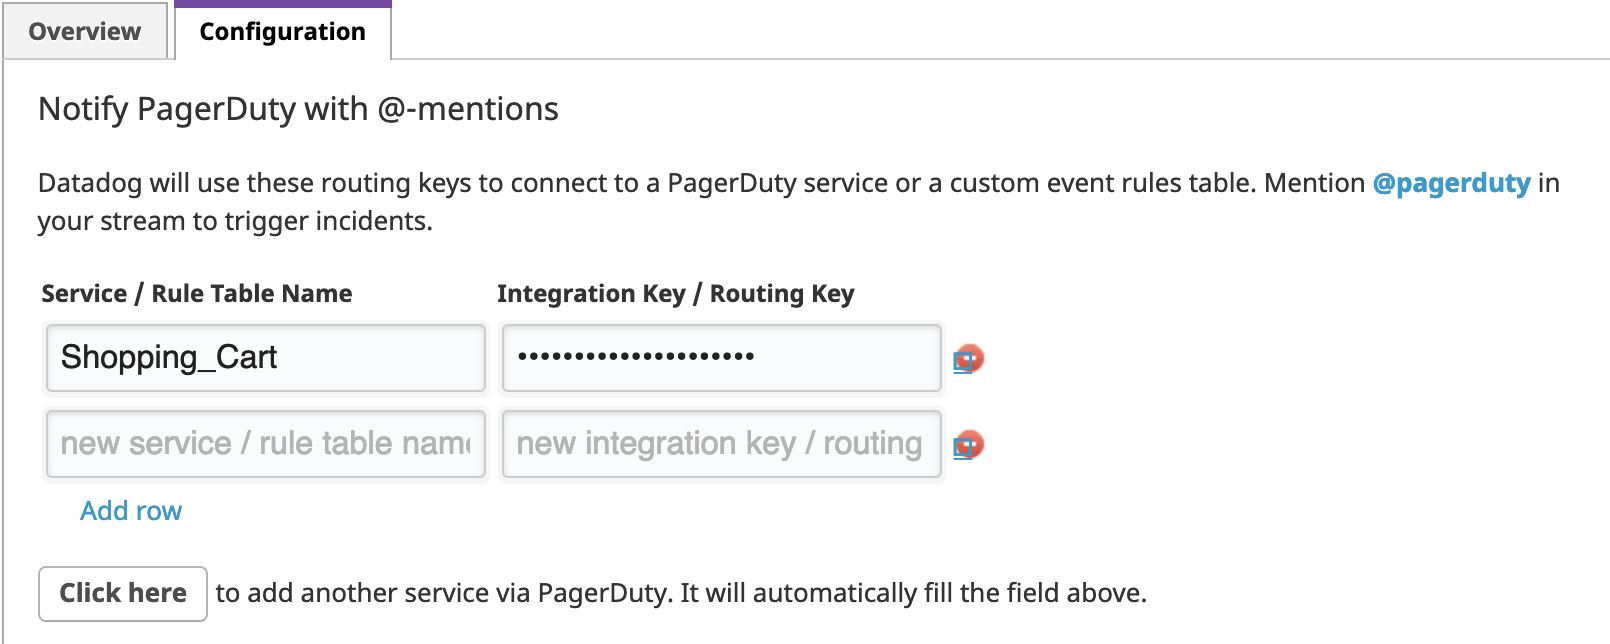
a. Notify PagerDuty with @ Mentions: If you would like to trigger, acknowledge or resolve incidents in PagerDuty via the Datadog event stream, you will need to input your Integration Key:
i. If you are Integrating with Global Event Routing: Delete the pre-filled information in the Service / Rule Table Name and Integration Key / Routing Key fields and enter a name and the Integration key generated in step 2 of the Integrating with Global Event Routing section.
ii. If you are Integrating with a PagerDuty Service: The service name and Integration key generated in step 5 of the Integrating with a PagerDuty Service section will be pre-filled for you and no action is needed. If you would like to add multiple services to your event stream, enter each service’s name and integration key in the
Service / Rule Table Name and Integration Key / Routing Key fields.
b. Show who is on-call in your event stream: If you would like to view your PagerDuty on-call schedules in your Datadog event stream, you will need to retrieve the PagerDuty schedule URL. In PagerDuty, navigate to the Configuration menu and select Schedules, then click your desired schedule and copy its URL, which should look like this: https://YOURSUBDOMAIN.pagerduty.com/schedules#PXXXXXX. In Datadog, paste this into the Schedule URL field.
c. You will then have two options to pull information from PagerDuty into your event stream:
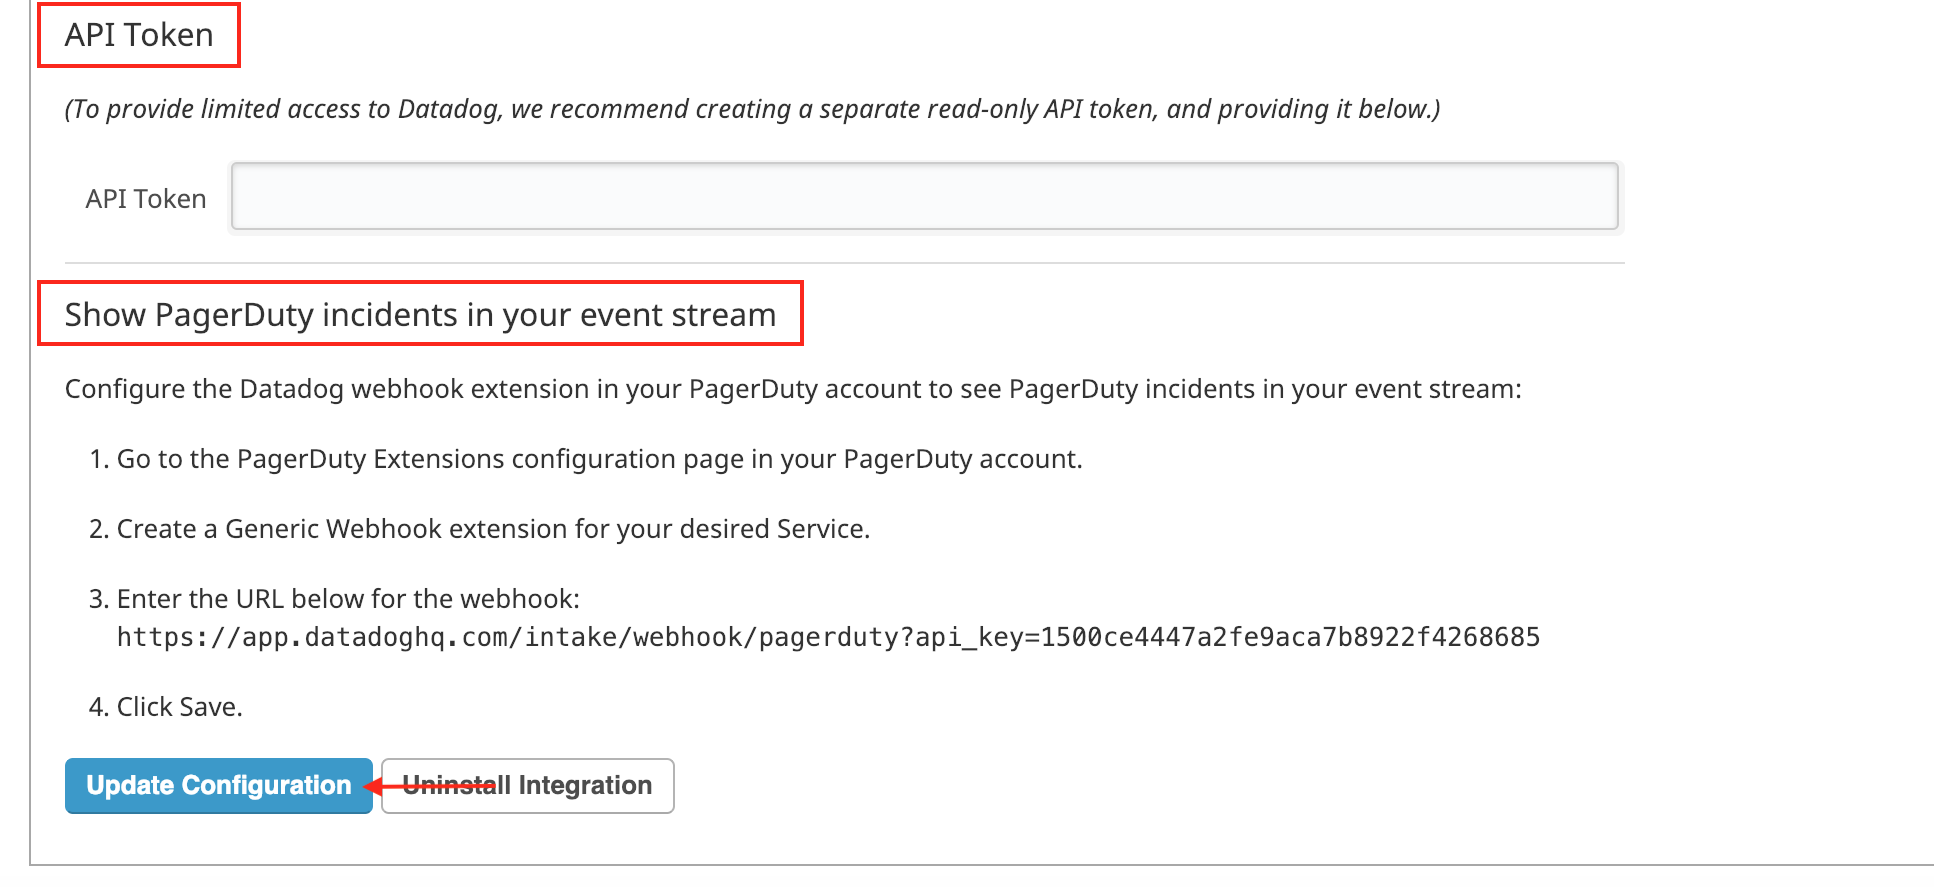
i. API Token: To pull limited information about PagerDuty incidents into your Datadog event stream, enter the PagerDuty REST API key here.
ii. Show PagerDuty incidents in your event stream: (Recommended) To pull information on PagerDuty into your Datadog event stream, follow the steps outlined in this section.
d. Once you have input these credentials, click Update Configuration at the bottom of the screen.
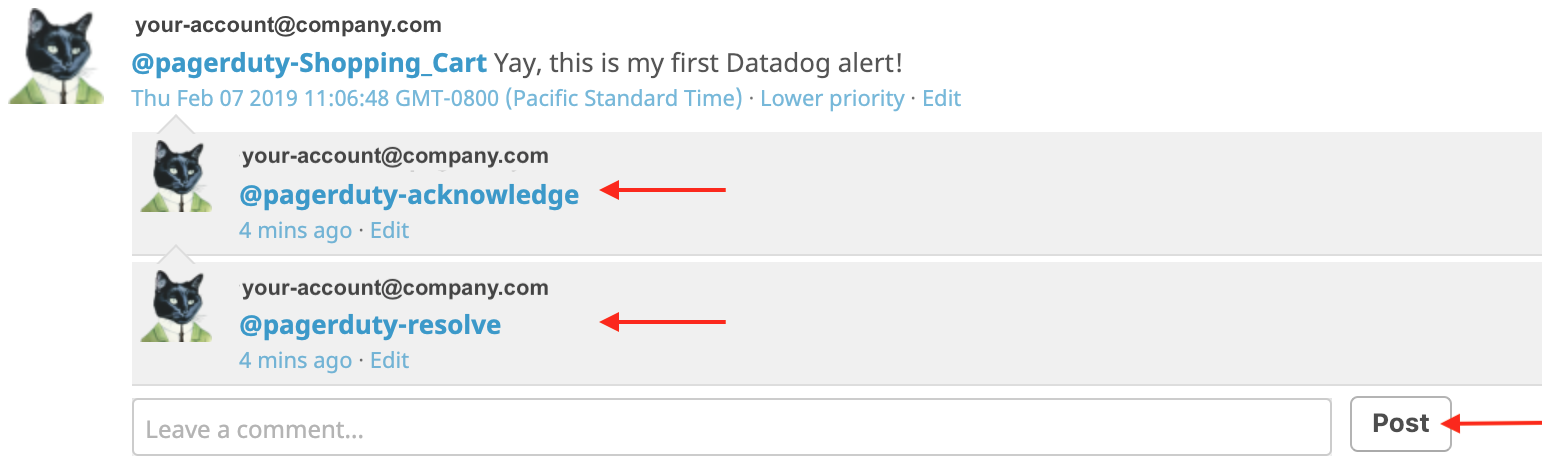
7. To test the integration, navigate to Events → Stream in the left menu and then compose a post in the Leave a status update… field with @pagerduty-[Service Name] (i.e. @pagerduty-Shopping-Cart Yay, this is my first Datadog alert!). Click Post and this post will show up in your Datadog event stream and create an incident in PagerDuty.

8. You can also ack or resolve the PagerDuty incident within Datadog by mentioning @pagerduty-acknowledge or @pagerduty-resolve.
9. Note: You must add these mentions as a comment on the original post in your event stream. You can simply use these mentions, and/or you can add comments which will appear as part of the ack or resolve message in the PagerDuty incident Timeline tab:
Yes. You have two options: integrating with global event routing or adding multiple services to the configuration. If you’re adding multiple services to the configuration, In the PagerDuty integration configuration, you will find your existing integrated service along with its integration key. Below that, click Add row and you will be able to input another Datadog integration on another service.
You can then reference the second service under Notify your team in a Datadog monitor, to send alerts to the the other service specifically for that monitor.
You can also click the Click here button to use the same integration setup workflow as was used for the first integration.
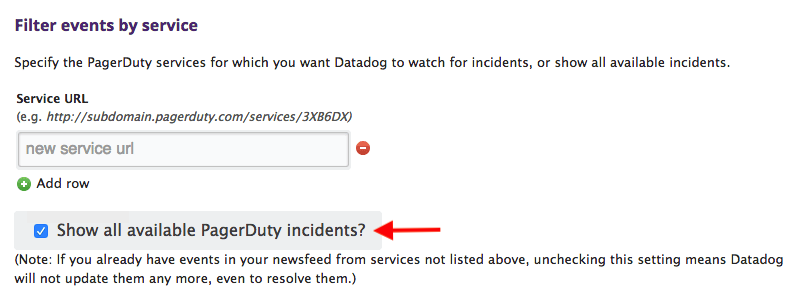
By default, the Show all available PagerDuty incidents? option is selected in the PagerDuty integration settings within Datadog. If you only want to see events from the services you have defined in the Filter Events by Service setting, you should uncheck this option in your integration setup.
Try PagerDuty free for 14 days — no credit card required.