Start Using PagerDuty Today
Try PagerDuty free for 14 days — no credit card required.
PagerDuty integrations require a Manager base role or higher for account authorization. If you do not have this role, please reach out to an Admin or Account Owner within your organization to configure the integration.
There are two ways that Nagios Core can be integrated with PagerDuty: via Global Event Routing or directly through an integration on a PagerDuty Service.
Integrating with Global Event Routing enables you to route events to specific services based on the payload of the event from Nagios Core. If you would like to learn more, please visit our article on Global Event Routing.
1. From the Automation menu, select Event Rules.
2. Select Default Global Ruleset or create a new one.
3. Click on the name of the ruleset you would like to use and click on the arrow next to Incoming Event Source to display the Integration key information. Copy your Integration Key and keep it in a safe place for later use. When you have finished setting up the integration in Nagios Core, you will return to this interface to specify how to route events from Nagios Core to services in PagerDuty.
Note: If your team has already integrated using Global Event Routing, you can verify by checking for the PagerDuty Event Rules Integration Key (found in step 3 above) in an existing configuration file. You can then use the existing integration and pipe Nagios Core events into your service by writing new Global Event Rules for your service.
You can now proceed to the In Nagios Core section of this guide.
Integrating with a PagerDuty service directly can be beneficial if you don’t need to route alerts from Nagios Core to different responders based on the event payload. You can still use service-level event rules to perform actions such as suppressing non actionable alerts and adjusting the severity.
1. From the Services menu, select Service Directory.
2. If you are adding your integration to an existing service, click the name of the service you want to add the integration to. Then select the Integrations tab and click the Add a new integration.
If you are creating a new service for your integration, please read our documentation in section Configuring Services and Integrations and follow the steps outlined in the Create a New Service section.
3. Select Nagios Core from the Integration Type menu.
4. Click Add Service or Add Integration to save your new integration. You will be redirected to the Integrations tab for your service.
5. Find your integration in the list and click ∨ to the right. An Integration Key will be generated on this screen. Keep this key saved in a safe place, as it will be used when you configure the integration with Nagios Core in the next section.
If you have already integrated Nagios Core in the past and would now like to integrate with additional services, skip to step 3.
This guide includes steps for Nagios Core as installed from readymade packages via apt-get (Debian-based, i.e. Ubuntu) and yum (RHEL-based, i.e. CentOS, Fedora) Linux package managers, as well as for systems on which Nagios Core has been installed from source (“source installations”). You do not need to execute all commands in this guide, only the ones for your type of system. Note that all commands provided are intended to be run as the root user.
1. Install the PagerDuty Agent. The agent receives events from Nagios Core and sends them to PagerDuty using a queue, provides logging that helps troubleshoot any problems, and automatically retries sending events if there is any connection failure (i.e. if your Nagios Core server temporarily loses connectivity). Note: If you haven’t already, we highly recommend switching to Python 3 to use the PagerDuty Agent. The Agent does not run on CentOS 5 or lower, as it requires a newer version of Python than the version included with CentOS 5. Please use the Perl-based integration for Nagios Core on older operating systems.
2. Download pagerduty_nagios.cfg from GitHub:
wget https://raw.githubusercontent.com/PagerDuty/pdagent-integrations/master/pagerduty_nagios.cfg
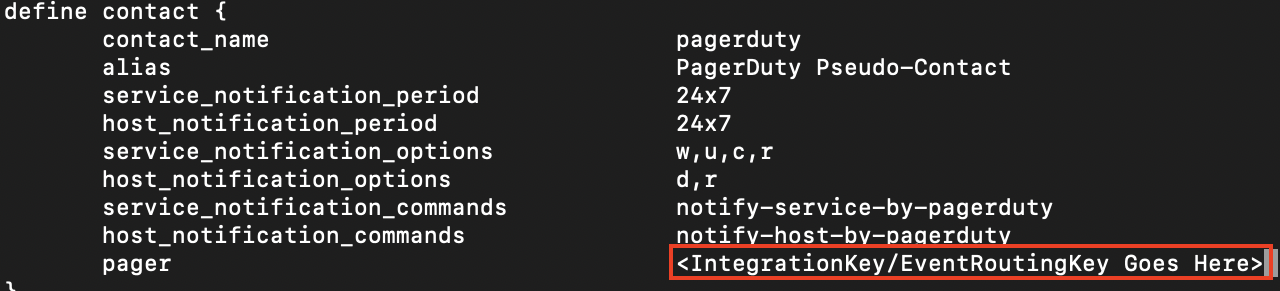
3. Open pagerduty_nagios.cfg in a text editor.
4. Enter the integration key (generated in the In PagerDuty section above) into the pager field. If you would like to integrate Nagios Core with multiple PagerDuty services at once, you can use Global Event Routing (instructions in the In PagerDuty section above) or you can read our article on integrating directly with multiple PagerDuty services.
5. Move the Nagios Core configuration file into place. For Debian-based systems this is usually /etc/nagios3/conf.d:
mv pagerduty_nagios.cfg /etc/nagios3/conf.d
For RHEL-based systems this is usually /etc/nagios:
mv pagerduty_nagios.cfg /etc/nagios
For source installations, move the file to /usr/local/nagios/etc/objects:
mv pagerduty_nagios.cfg /usr/local/nagios/etc/objects
6. Skip this step if you are using a Debian-based distribution. If you are using a RHEL-based distribution, you will need to edit the Nagios Core config to load the PagerDuty config. To do this, open /etc/nagios/nagios.cfg and add this line to the file:
cfg_file=/etc/nagios/pagerduty_nagios.cfg
If using a source installation, add this line to the main config file at /usr/local/nagios/etc/nagios.cfg
cfg_file=/usr/local/nagios/etc/objects/pagerduty_nagios.cfg
7. Add the contact “pagerduty” to your Nagios Core configuration’s main contact group. If you’re using the default configuration, open /etc/nagios3/conf.d/contacts_nagios2.cfg (on Debian-based systems) or /etc/nagios/objects/contacts.cfg (on RHEL-based systems) or /usr/local/nagios/etc/objects/contacts.cfg (for source installations) and look for the “admins” contact group. Then, simply add the “pagerduty” contact.
define contactgroup{
contactgroup_name admins
alias Nagios Administrators
     members root,pagerduty ; Add pagerduty here
}
8. Reload or restart Nagios Core for your configuration changes to take effect:
service nagios3 restart
service nagios restart
9. Download pagerduty.cgi:
wget https://raw.githubusercontent.com/mdcollins05/pd-nag-connector/master/pagerduty.cgi
10. Edit the pagerduty.cgi file so that the command_file variable points to your Nagios Core command file. The path can be found by running the command grep "^command_file" /etc/nagios3/nagios.cfg (on Debian-based systems) grep "^ *command_file" /etc/nagios/nagios.cfg (on RHEL-based systems), or grep "^ *command_file" /usr/local/nagios/etc/nagios.cfg (on source installations). If you don’t see any information returned, make sure the command_file variable is uncommented (doesn’t start with a #).
11. Move pagerduty.cgi to the Nagios cgi-bin.For Debian-based systems this is usually /usr/lib/cgi-bin/nagios3/:
mv pagerduty.cgi /usr/lib/cgi-bin/nagios3/
For most RHEL-based systems this is usually /usr/lib64/nagios/cgi/:
mv pagerduty.cgi /usr/lib64/nagios/cgi/
For Amazon Linux & CentOS 6+ systems this is usually /usr/local/nagios/sbin:
mv pagerduty.cgi /usr/local/nagios/sbin/
12. Make pagerduty.cgi executable.
For Debian-based systems:
chmod +x /usr/lib/cgi-bin/nagios3/pagerduty.cgi
For most RHEL-based systems:
chmod +x /usr/lib64/nagios/cgi/pagerduty.cgi
For Amazon Linux & CentOS 6+ systems:
chmod +x /usr/local/nagios/sbin//pagerduty.cgi
13. Install the required Perl libraries for the script to work.
For Debian-based systems:
apt-get install libwww-perl libjson-perl
For Ubuntu 16.04 systems, you will also need to install libcgi-pm-perl:
apt-get install libwww-perl libjson-perl libcgi-pm-perl
For RHEL-based systems:
yum install perl-JSON perl-CGI perl-libwww-perl
14. Skip this step if you are using a RHEL-based distribution. If you are using a Debian-based distribution, you will need to make sure Nagios Core has external commands enabled. In /etc/nagios3/nagios.cfg, check that variable check_external_commands equals 1 and that the variable command_check_interval is set to a reasonable value for your environment. The command_check_interval variable determines how often Nagios Core checks for external commands to run.
15. Skip this step if you are using a RHEL-based distribution. If you are using a Debian-based distribution, you will need to make sure that your web server user (usually www-data) is able to write to the Nagios Core command file. The following commands enable this for the default command file location:
/etc/init.d/nagios3 stop ## Note: This will stop your Nagios service!
dpkg-statoverride --update --add nagios www-data 2730 /var/lib/nagios3/rw
dpkg-statoverride --update --add nagios nagios 751 /var/lib/nagios3
/etc/init.d/nagios3 start
1 . Go to each service that is integrated with Nagios Core, click to the Integrations tab, click Add or manage extensions, then click + New Extension.
2. For the Extension Type select Nagios, then enter in a Name for your webhook, paste in your Nagios Username, Password and Root URL, and click Save. The URL will look similar to this: ip-or-domain/nagios3/cgi-bin/pagerduty.cgi . Do not include http:// or https://. Note: Unless you’ve disabled it, the Nagios Core web interface requires a username and password. We highly recommend configuring a user that is able to run Nagios Core commands that is only used for the webhook. If you go to this URL in your browser you should see 400 Requests must be POSTs. If you do not see this, check your web server logs for details on what happened when you tried to call this URL.
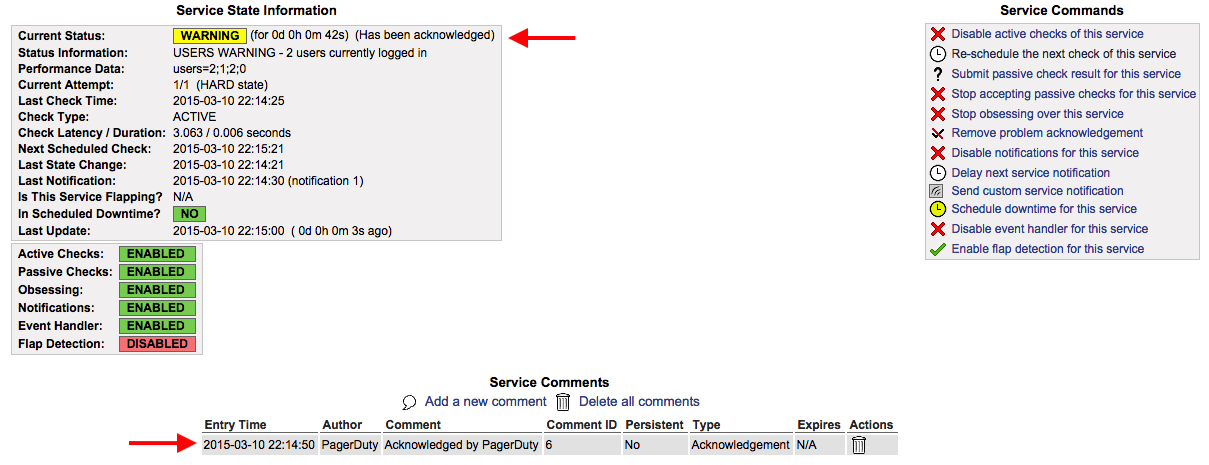
3. To test this integration, you will need to have an issue within Nagios Core that generates an event and triggers an incident in PagerDuty. From there, acknowledging the incident should add a comment stating the incident has been “Acknowledged by PagerDuty”.
The two-way integration requires that your Nagios Core server be accessible over the internet to receive webhook calls from PagerDuty. If you wish to restrict access to your Nagios Core web server to specific IPs, you can find PagerDuty’s webhook IPs in our knowledge base: Safelisting IPs. Alternatively, you can use a service like ngrok to create a secure tunnel to your Nagios Core server with a public URL that can be used for your webhook.
This is easy to do with the current integration, as a Nagios Core service in PagerDuty is directly mapped to a “contact” in Nagios Core. By default, this contact is named pagerduty and defined in the pagerduty_nagios.cfg file. In order to configure multiple services, just duplicate the existing contact definition and rename it (i.e. pagerduty_database, pagerduty_network, etc.). Then copy and paste the corresponding Integration Key from PagerDuty into the pager field. Don’t forget to restart your Nagios Core for the changes to take effect. Another option for configuring multiple services is using a Global Event Routing integration key (see the Integrating With Global Event Routing section above).
If a PagerDuty server can’t be reached for any reason, events will be stored to an on-disk queue. The PagerDuty agent will attempt to re-send the events when connectivity is restored.
You should configure an external ping check service such as StatusCake or NodePing to monitor your site’s external connectivity. Of course, you can use PagerDuty to receive alerts from these services as well.
First, make sure you’ve installed the PagerDuty Agent, and that there were no errors from your package manager when attempting to install it. Failed installs (i.e. due to an incompatible distribution, such as CentOS 5) are the most common issue with the integration not working.
Check that the pagerduty contact is getting the HOST or SERVICE NOTIFICATIONS in syslog. You can grep your syslog to see if the pagerduty contact is being notified. Here’s an example from an Ubuntu system (on RHEL-based systems, syslog is at /var/log/messages):
grep NOTIFICATION /var/log/syslog
May 28 18:20:57 ip-10-11-139-249 nagios3: SERVICE NOTIFICATION: pagerduty;localhost;Current Users;CRITICAL;notify-service-by-pagerduty;USERS CRITICAL - 3 users currently logged in
As you can see, the pagerduty contact was notified for this SERVICE NOTIFICATION. If the pagerduty contact never shows up, that means that the pagerduty contact is not associated with notifications for the host/service in question. If you’re using the default configuration, make sure that the pagerduty contact is a member of the admin’s contact group. If the pagerduty contact is getting notified, check the agent log at /var/log/pdagent/pdagentd.log.
More troubleshooting tips can be found in our Nagios Troubleshooting Guide.
PagerDuty can process PROBLEM, ACKNOWLEDGEMENT, and RECOVERY messages. All other messages, including FLAPPINGSTART and FLAPPINGSTOP, are ignored.
Try PagerDuty free for 14 days — no credit card required.