Opsview Integration Guide

Opsview is a fork of the popular Nagios monitoring system. As such, the process for integrating it with your PagerDuty account is similar to the process for configuring Nagios.

By integrating PagerDuty into your existing Nagios monitoring solution, you can have Nagios alerts go directly to the the right person who can solve the issue.

Setting up the PagerDuty / Opsview integration

In PagerDuty

  1. From the Services menu, select Service Directory.
  2. On your Services page:If you are creating a new service for your integration, click +Add New Service.If you are adding your integration to an existing service, click the name of the service you want to add the integration to. Then click the Integrations tab and click the Add a New Integration link.
  3. Select your app from the Integration Type menu and enter an Integration Name.If you are creating a new service for your integration, in General Settings, enter a Name for your new service. Then, in Incident Settings, specify the Escalation Policy, Notification Urgency, and Incident Behavior for your new service.
  4. Click the Add Service or Add Integration button to save your new integration. You will be redirected to the Integrations page for your service.
    RS-Integration-Settings
  5. Copy the Integration Key for your new integration: RS_API_pd_3

On Your Server

  1. Install the necessary Perl dependencies:
    aptitude install libwww-perl libcrypt-ssleay-perl

    OR

    yum install perl-libwww-perl perl-Crypt-SSLeay
  2. Download pagerduty_nagios.pl and copy it to /usr/local/nagios/libexec/notifications.
    wget https://raw.github.com/ryanhoskin/pagerduty-opsview-pl/master/pagerduty_nagios.pl
    cp pagerduty_nagios.pl /usr/local/nagios/libexec/notifications
  3. Make sure the file is executable by the nagios user.
    chmod 755 /usr/local/nagios/libexec/notifications/pagerduty_nagios.pl
  4. Enable environment variable macros in /usr/local/nagios/configs/Master Monitoring Server/nagios.cfg (if not enabled already).
    enable_environment_macros=1
  5. Edit the nagios user’s crontab.
    crontab -u nagios -e
  6. Add the following line to the crontab.
    * * * * * /usr/local/nagios/libexec/notifications/pagerduty_nagios.pl flush

In Opsview

  1. Go to your Opsview web management interface.
  2. Go to Advanced > Notification Methods.
  3. Click on the + icon.
  4. Fill out the form as follows (Make sure that you enter PAGERDUTY_SERVICE_KEY and not your actual service key in the Contact Variables field).

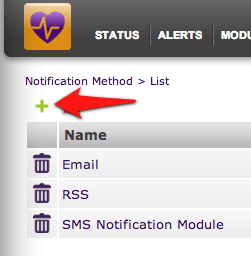
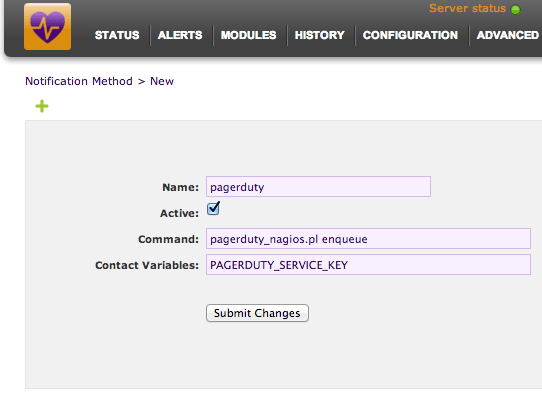
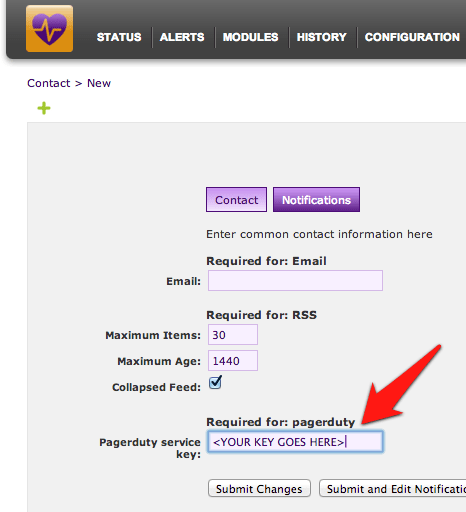
    Note:  If you are using Opsview 4 or greater, you will want to change the command to the following by replacing PAGERDUTY_SERVICE_KEY with your service API key.

    pagerduty_nagios.pl enqueue -f CONTACTPAGER="PAGERDUTY_SERVICE_KEY"
  5. Click on Submit Changes.
  6. Go to Configuration > Contacts.
  7. Click on the + icon.
  8. Fill out the form as follows (password can be anything):
  9. Click on Notifications.
  10. Enter your Service API Key into the box that states: Required for PagerDuty. Your service key can be found under Services > (Your service name) > Integration Settings > Service API key.
  11. Click on Submit and Edit Notification Profiles.
  12. Click on the + icon.
  13. Enter the name “pagerduty” and check the pagerduty box under the “Notify by:” section. Leave all other settings as the defaults.
  14. Click on Submit Changes.
  15. Click on the “Configuration status” link (found above the menus) and then click “Reload Configuration” button to force OpsView generate all Nagios configuration files.

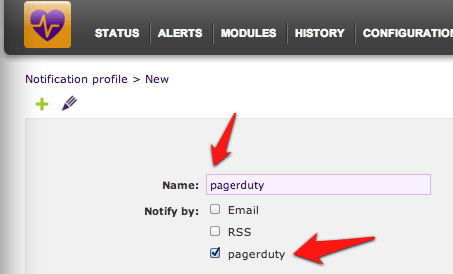
You’ve now added Opsview notifications to PagerDuty.

FAQ

How do I setup Opsview to work with multiple PagerDuty services?

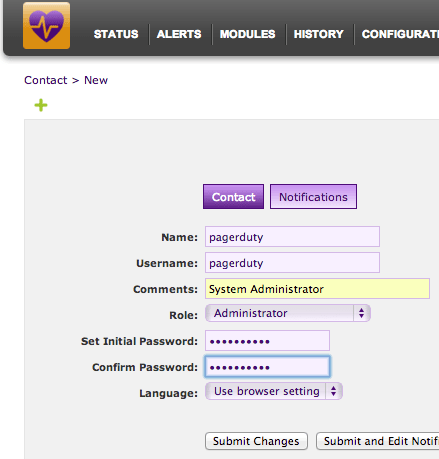
This is easy to do with the current integration, as a Nagios Service in PagerDuty is directly mapped to a contact. By default, this contact is named “pagerduty” and defined Configuration > Contacts.

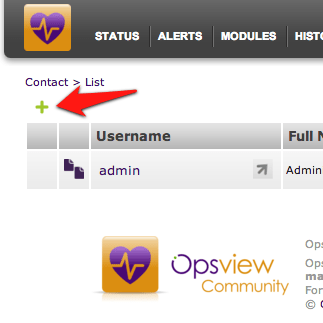
In order to setup multiple services, just duplicate the existing contact definition and rename it (i.e. pagerduty_database, pagerduty_network, etc.). Then copy and paste the corresponding API Key from PagerDuty into the “pager” field. Don’t forget to restart your Nagios for the changes to take effect.

What if a Opsview event happens while my network is down?

If a PagerDuty server can’t be reached for any reason, events will be stored to an on-disk queue. The installed cron job will attempt to re-send the events at one minute interval.

If a PagerDuty server can’t be reached for any reason, events will be stored to disk and the at one minute intervals.

Since Opsview needs my external Internet connection to send failure reports to PagerDuty, how will I receive notification if our site loses external connectivity?

You should configure an external ping check service to monitor your site’s external connectivity. Of course, you can use PagerDuty to forward alerts from these services.

It doesn’t seem to be working. What’s going on?

Check the syslog for messages from “pagerduty_nagios”. On most systems:

grep pagerduty_nagios /var/log/syslog


Please contact us if you’re unable to sort out the difficulty.

What sort of Nagios messages does PagerDuty understand?

PagerDuty can process PROBLEM, ACKNOWLEDGEMENT, and RECOVERY messages. All other messages, including FLAPPINGSTART and FLAPPINGSTOP, are ignored. If you’d like PagerDuty to process additional Nagios messages, please let us know!

Start Using PagerDuty Today

Try PagerDuty free for 14 days — no credit card required.