- PagerDuty /
- Integrations /
- Red Gate SQL Monitor Integration Guide
Red Gate SQL Monitor Integration Guide
Red Gate SQL Monitor is a world-class performance monitoring tool for Microsoft SQL Server databases. SQL Monitor provides comprehensive machine, cluster, server and database health checks and performance dashboards. It also offers a rich reporting and fault analysis engine to help you quickly diagnose the root cause of db operational issues.SQL Monitor can be easily configured to send alerts to PagerDuty (via email), thus allowing you to take advantage of PagerDuty’s comprehensive alerting and incident tracking functionality.
You can set up PagerDuty to alert your database admins and sysadmins via phone call and SMS, as well as email of course. You’ll also be able to configure automatic escalation of alerts, handle alerts on-the-go from a mobile phone, and set up on-call duty scheduling.
What you’ll need to get started
You’ll need an installation of SQL Monitor. For best results, we recommend using version 2.3 or any later version. Older versions of SQL Monitor will also work, but you will miss out on automatic resolution of incidents in PagerDuty when the underlying db problems have been fixed. You’ll also miss out on the ability to configure alert filters based on the severity of the SQL Monitor alert. If you don’t have SQL Monitor, you can get the latest version here. You will also need a PagerDuty account; either a paid account or free trial will work.Setting up the PagerDuty / SQL Monitor integration
In PagerDuty
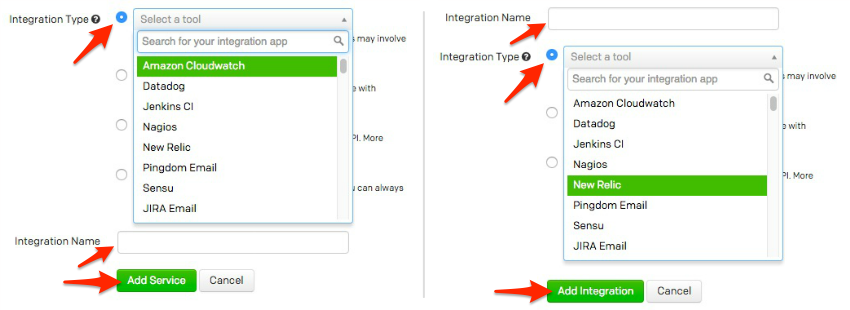
- From the Services menu, select Service Directory.
- On your Service Directory page: If you are creating a new service for your integration, click +New Service.If you are adding your integration to an existing service, click the name of the service you want to add the integration to. Then click the Integrations tab and click the Add a new integration hyperlink.
- Select your app from the Integration Type menu and enter an Integration Name.If you are creating a new service for your integration, in General Settings, enter a Name for your new service. Then, in Incident Settings, specify the Escalation Policy, Notification Urgency, and Incident Behavior for your new service.
- Click the Add Service or Add Integration button to save your new integration. You will be redirected to the Integrations page for your service.
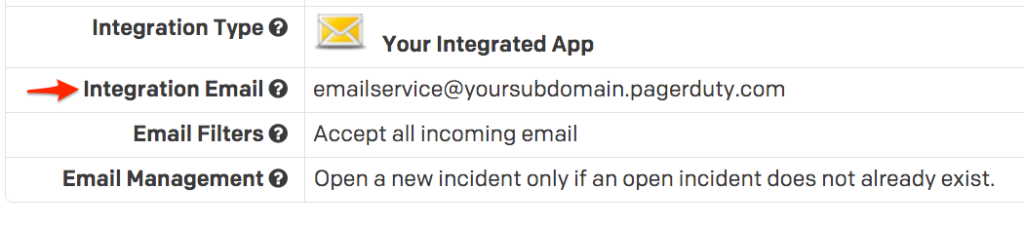
- Copy the Integration Email for your new integration:
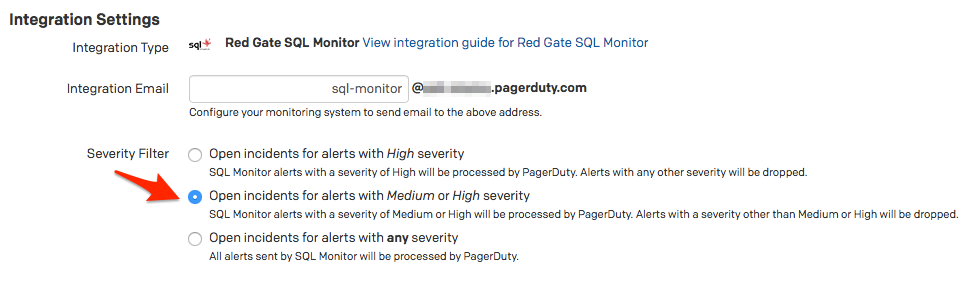
- (Optional) By default, your new integration only opens new incidents for Medium or High severity alerts received from SQL Monitor. To modify this setting, from the service page, click on the Edit Service button on the right sidebar. You’ll then be able to configure the service to open incidents only for High severity alerts, only for High and Medium severity alerts, or for any alert.

In SQL Monitor:
- Click on the Configuration tab.
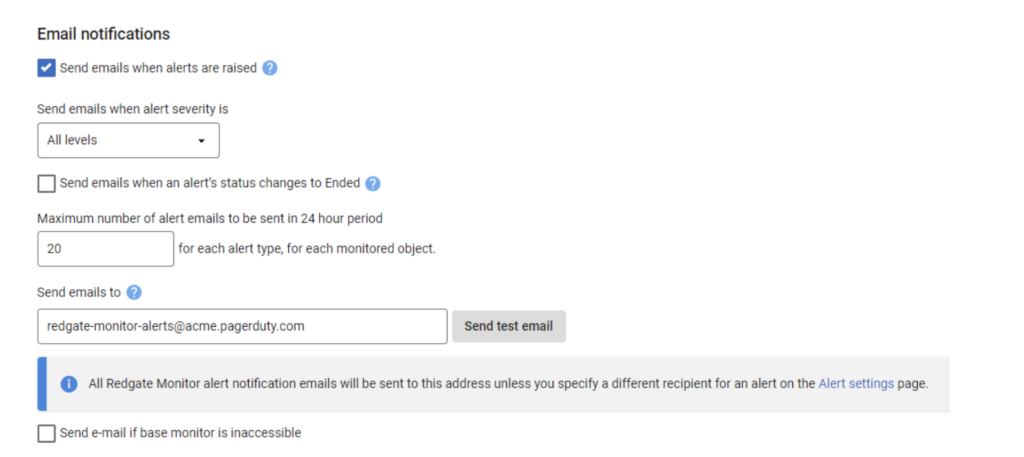
- Under the Alerts section, click on Email settings.
- In the Send emails to field-box, paste the Integration email from step 4 in PagerDuty. Also be sure to set a from email address for the alert emails (example: sql-monitor@your-company.com).
Ready to get started?
Try any product on the Operations Cloud for free.
No credit card required.