Start Using PagerDuty Today
Try PagerDuty free for 14 days — no credit card required.
There are two ways to integrate with PagerDuty: via global event routing or directly through an integration on a PagerDuty service. Integrating with global event routing may be beneficial if you want to build different routing rules based on the events coming from the integrated tool. Integrating with a PagerDuty service directly can be beneficial if you don’t need to route alerts from the integrated tool to different responders based on the event payload.
1. From the Automation menu, select Event Rules and click your Default Global Ruleset.
2. On the Event Rules screen, copy your Integration Key.
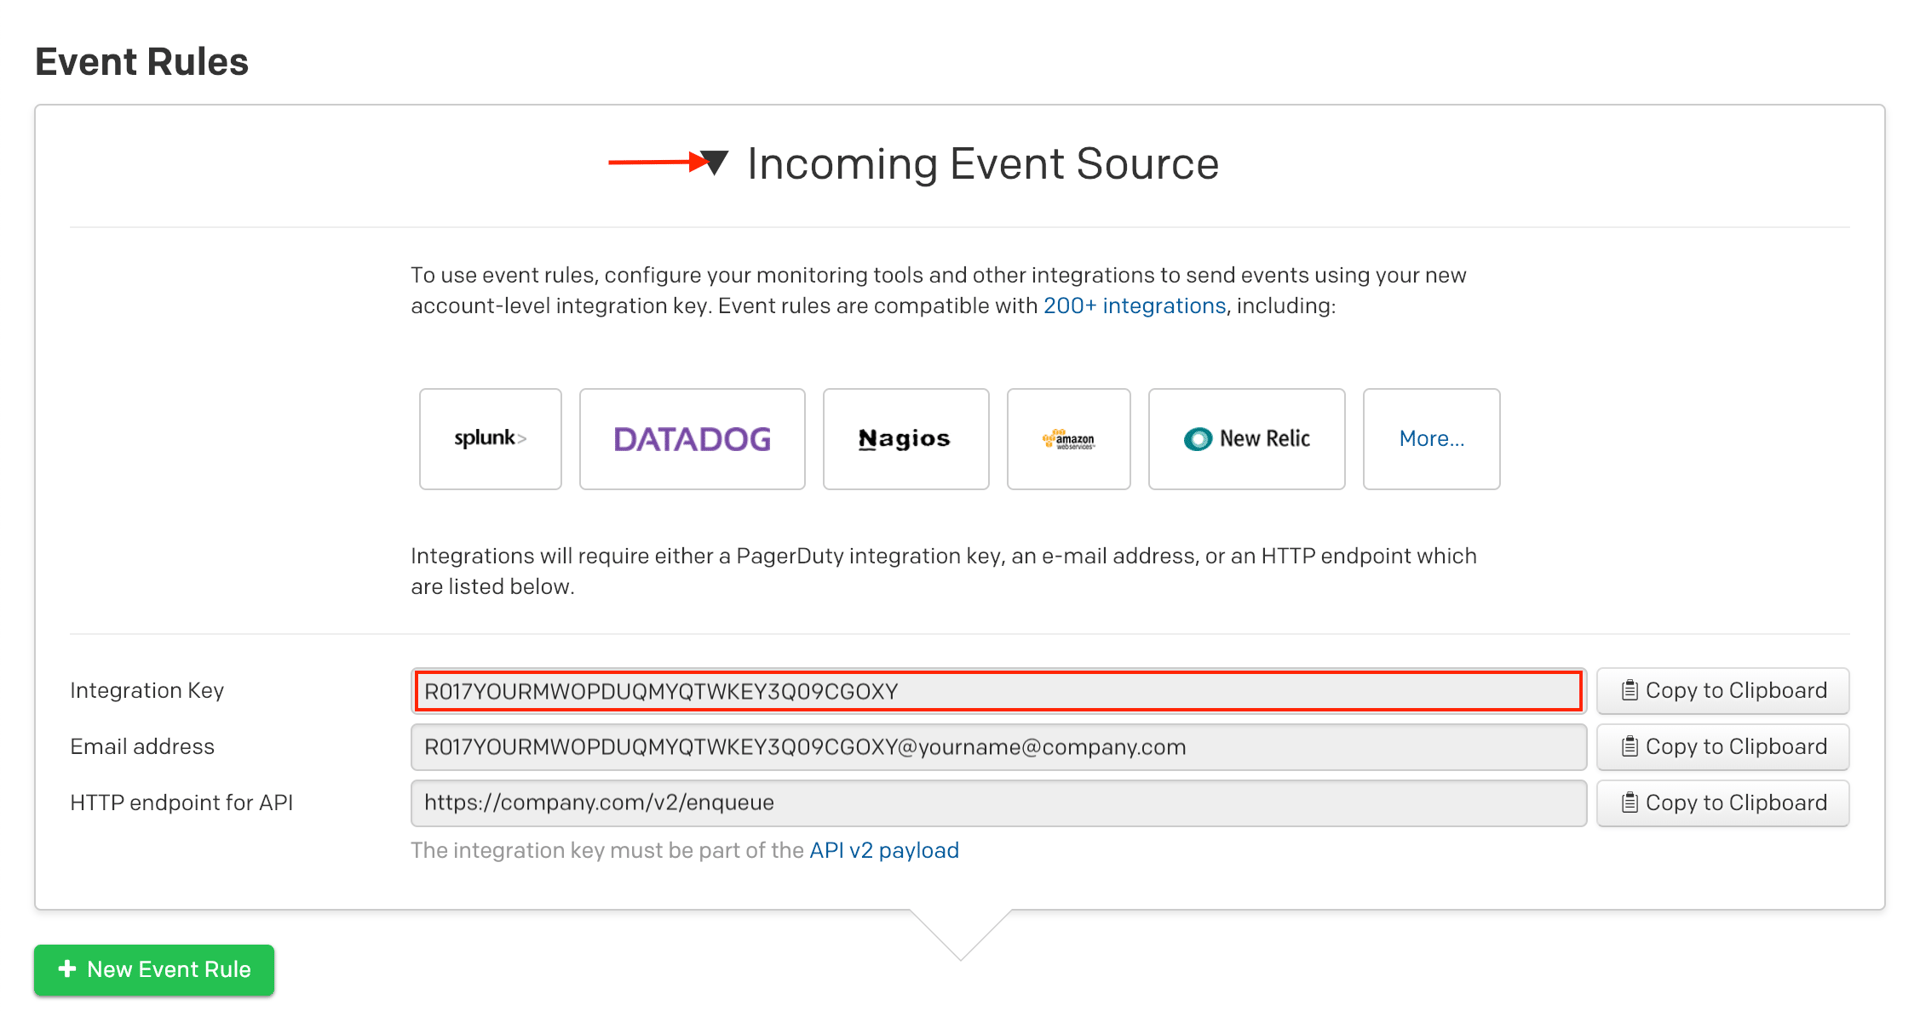
3. Once you have your Integration Key, the Integration URL will be:
https://events.pagerduty.com/x-ere/[YOUR_INTEGRATION_KEY_HERE]
You can now proceed to the In Splunk section below.
1. From the Services menu, select Service Directory.
2. If you are adding your integration to an existing service, click the name of the service you want to add the integration to. Then select the Integrations tab and click the Add a new integration.
If you are creating a new service for your integration, please read our documentation in section Configuring Services and Integrations and follow the steps outlined in the Create a New Service section.
3. Select Splunk from the Integration Type menu.
4. Click Add Service or Add Integration to save your new integration. You will be redirected to the Integrations tab for your service.
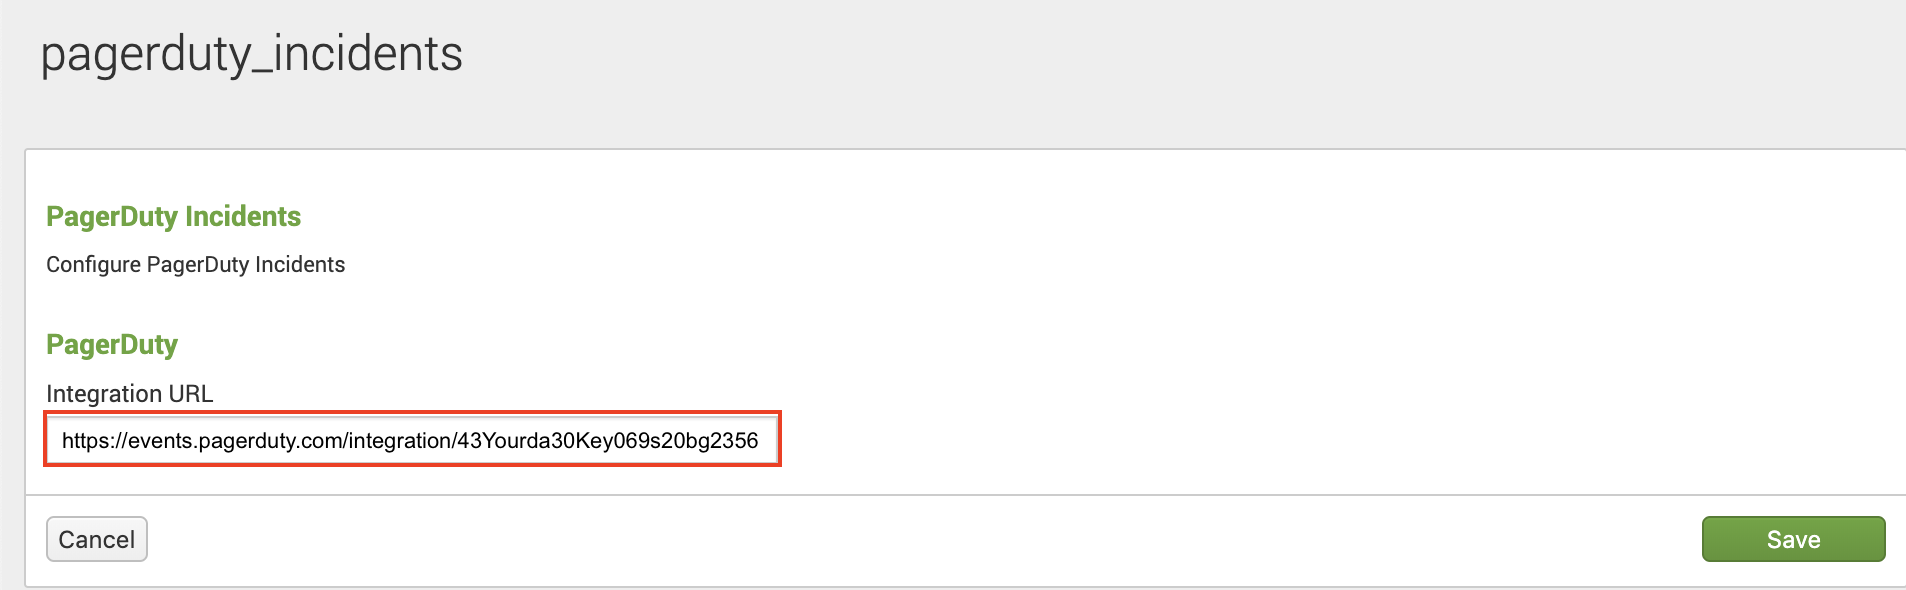
5. Find your integration in the list and click ∨ to the right. Copy the Integration URL and keep it in a safe place for later use.
1. Click the + in the left hand menu to download the PagerDuty Incidents app from the Splunkbase.
2. Search for the PagerDuty App for Splunk and then click Install.
3. Once the PagerDuty app has been installed, navigate to the Settings menu and choose Alert actions.
4. Ensure that the PagerDuty app’s Status is Enabled and then click Setup PagerDuty on the right.
5. Paste the Integration URL (generated in the In PagerDuty section, above) for your PagerDuty service into the supplied field.
6. Run the search in Splunk that you would like to create an alert for. We recommend testing by searching Splunk’s internal logs for failed login attempts: index=_internal component=UiAuth action=login status=failure
7. Click the Save As dropdown on the right and select Alert.
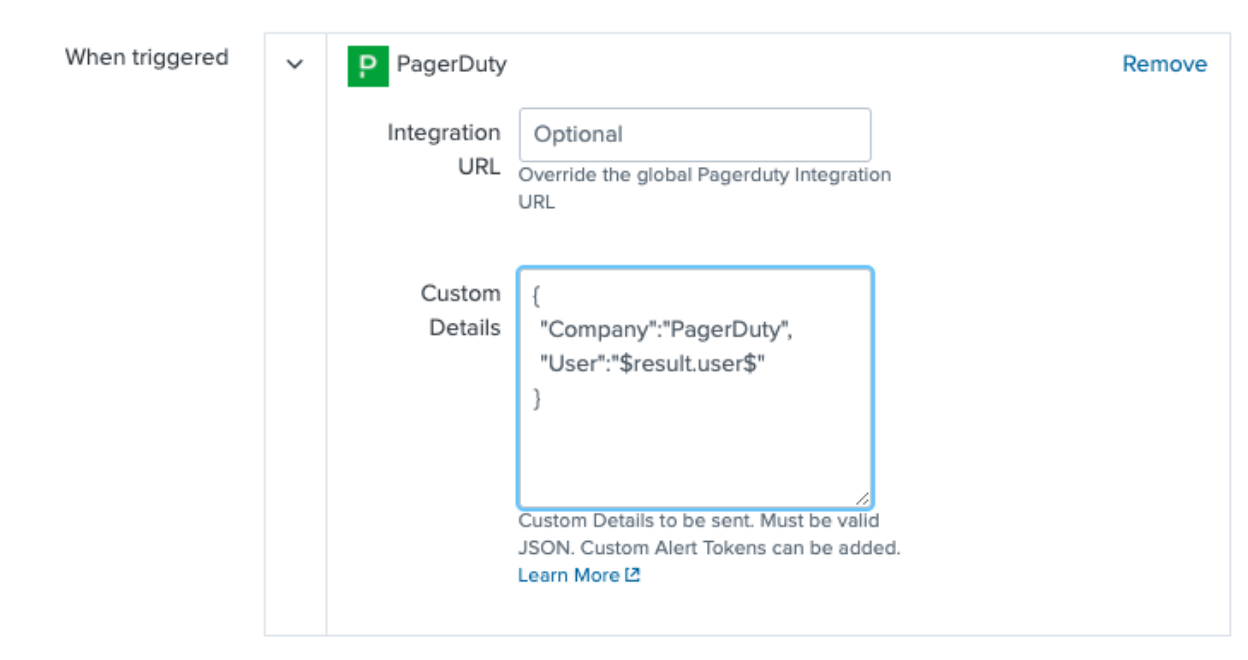
8. Add a Title for the new alert, specify the conditions under which you’d like it to trigger an alert, and add a new Trigger Action. Select PagerDuty as the trigger action type and click Save. By default, this will notify the Integration URL you established when you set up the PagerDuty app (step 5, above). The Title will be used for the incident Title in PagerDuty.
9. In order to enable search on Splunk alerts, enter the following in the Custom Details field: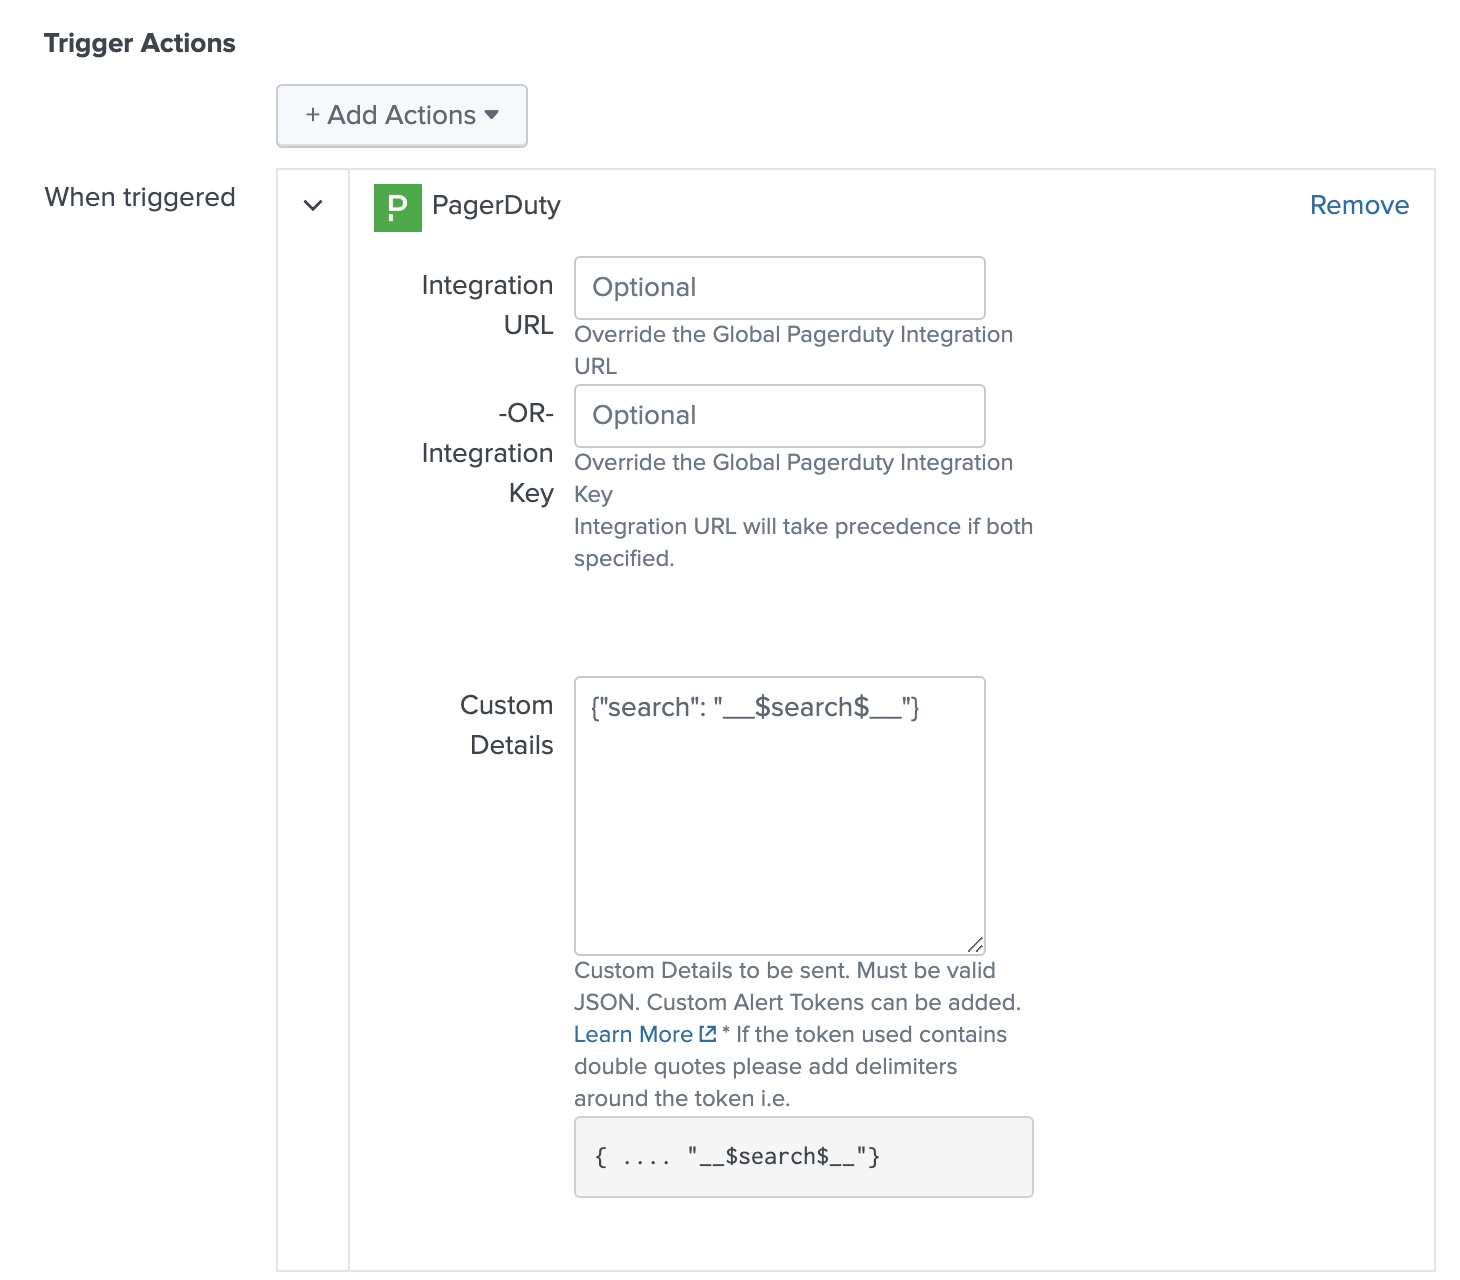
10. You may optionally add more custom details based on your use case. Adding custom details gives on-call users more information to troubleshoot an alert. On the PagerDuty incident screen, navigate to the Details section and enter your custom details in the Custom Details field for sent information. Note: This must be in a valid JSON format.
We recommend testing your integration with a simple search that is easy to manipulate, like the above-referenced:
index=_internal component=UiAuth action=login status=failure
This will produce results any time there is a failed login attempt and is an easy situation to reproduce. Set your search either to run on a schedule or to be run in real-time and set your threshold low (Number of results is greater than 0, for example). Open Splunk in another browser or in an incognito window and make some failed login attempts. Not long after, you should see a new PagerDuty incident.
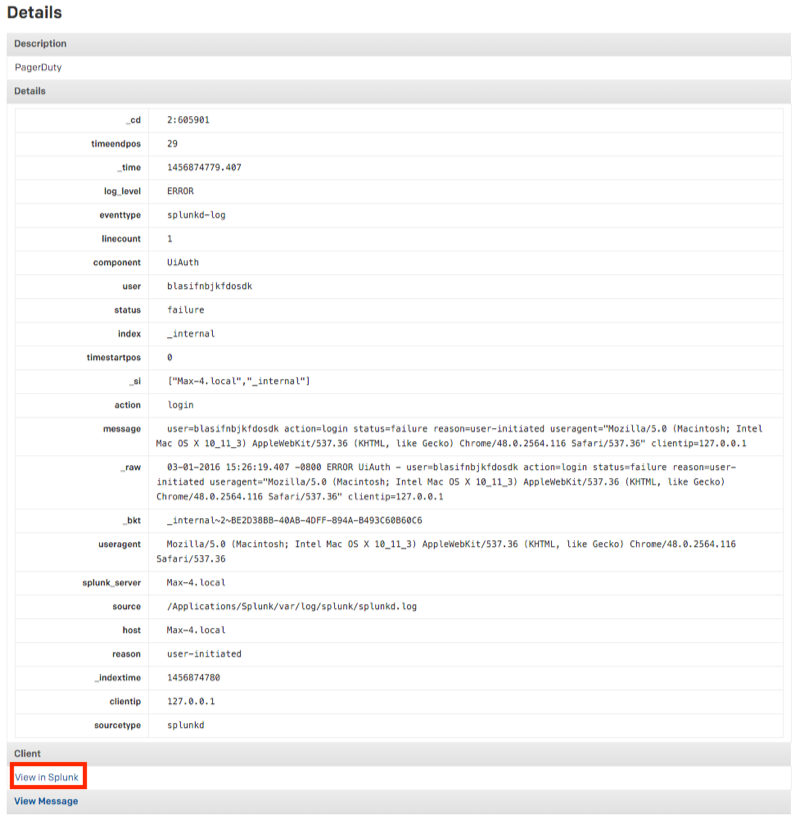
Clicking to the incident details will provide a breakdown of the alert and will provide you with a link to view the search in Splunk.
We will create a custom detail to accompany the same simple search referenced above:
index=_internal component=UiAuth action=login status=failure
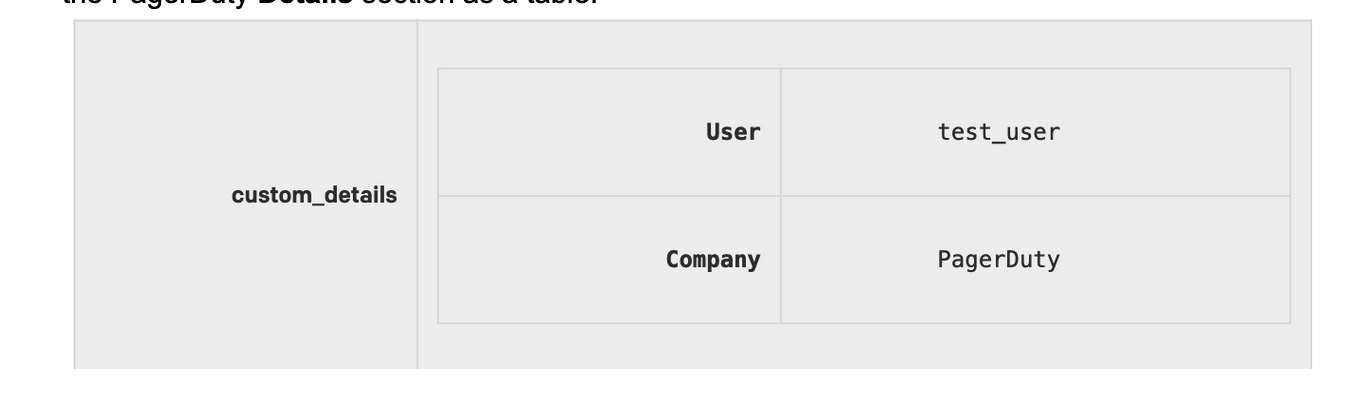
As an additional step to Step 9, we will need to fill out the Custom Details section in the PagerDuty Trigger Action. As stated earlier, this should be valid JSON an example of this is:
Customer Alert Token and be used, you can learn more here. Valid JSON alerts will appear in the PagerDuty Details section as a table:
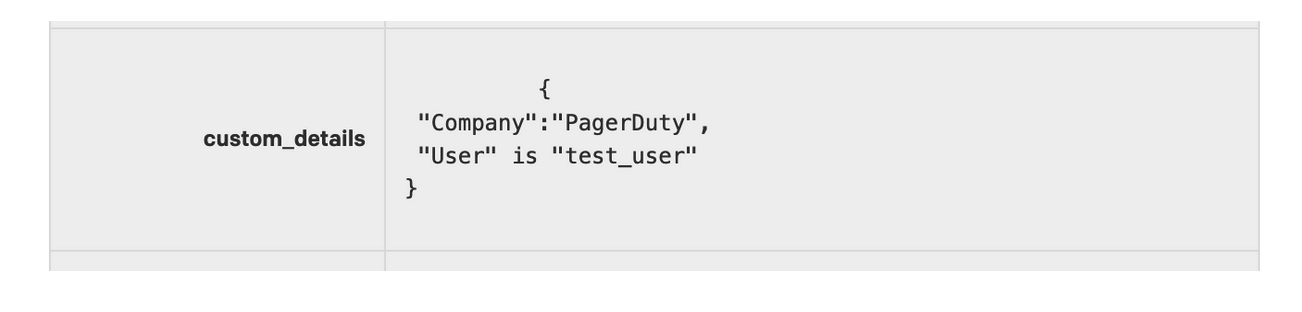
Invalid JSON will appearing in PagerDuty Details section as a string
Are there other ways Splunk can send alerts to more than one PagerDuty service?
Yes. Along with using the Integration URL field under Trigger Actions, one can integrate using global event rules during Step 5 and routing to different services based on event rules.
No. At this time, the PagerDuty incident must be resolved from PagerDuty.
If you select Edit Service from the main service view, you’ll be able to choose to group incidents by search name, component, host, source or to attach all incoming alerts to an open incident.
Does the integration work with Search Head Clustering?
Yes it does. Version 2.0.3 or higher is required.
Try PagerDuty free for 14 days — no credit card required.