- PagerDuty /
- Blog /
- Integrations /
- Leverage Observability With OpenTelemetry to Understand Root Cause Quickly
Blog
Leverage Observability With OpenTelemetry to Understand Root Cause Quickly
by Clay Smith
June 23, 2021
| 5 min read
An observability solution should help any incident responder understand what changed and why. A lot has been written on the difference between monitoring and observability, but an easy way to understand how both are integral to incident response is to consider how customers use PagerDuty—with both monitoring and observability tools—to get to the right answer. The business benefit of reduced time and effort required to identify and fix a problem is realized in improved customer experience.
Lost in a Sea of Tabs
Given the nature of the workflow, hooks between PagerDuty and monitoring and observability solutions are not new; however, most changes and events that are related to a running service aren’t connected to technical metrics like latency and errors. If you’re lucky, you might get markers on a metrics chart to visually correlate a measurement with a recent deployment. Chart markers or overlays are useful with traditional architectures (i.e. a web server talking to a database), but scale very poorly with distributed systems when there are dozens of changes happening across hundreds of services at any point in time.
Use OpenTelemetry to Build an Event-Driven Observability Pipeline
OpenTelemetry is a unified standard that helps companies combine different types of telemetry across applications and services in a vendor-neutral way. Its benefits also extend to any DevOps or cloud tool. OpenTelemetry, at its core, defines a data model that can describe what’s happening throughout the development lifecycle, including metrics related to the performance of code or infrastructure, relationships between services, and detailed technical metadata.
With over 100 different integrations (and counting), OpenTelemetry also dramatically increases the number of potential workflows between solutions without requiring any new development, custom instrumentation, or API connections. And because it’s an open-source standard, it’s easy to extend. In this case, it enables us to connect active PagerDuty incidents to related monitoring data.
Using the OpenTelemetry collector, we wrote an integration that tags all metrics and traces with related incident identifiers. Whenever a PagerDuty incident is triggered and resolved, we’ll update tags on our metrics and traces with a link back to the active incident.
As an observability platform, Lightstep can now produce efficient resolution paths as a result.
The Gold Path: PagerDuty and Lightstep Change Intelligence
In this example, latency for an online ecommerce site spikes and a PagerDuty incident is created for the “nginx” service.
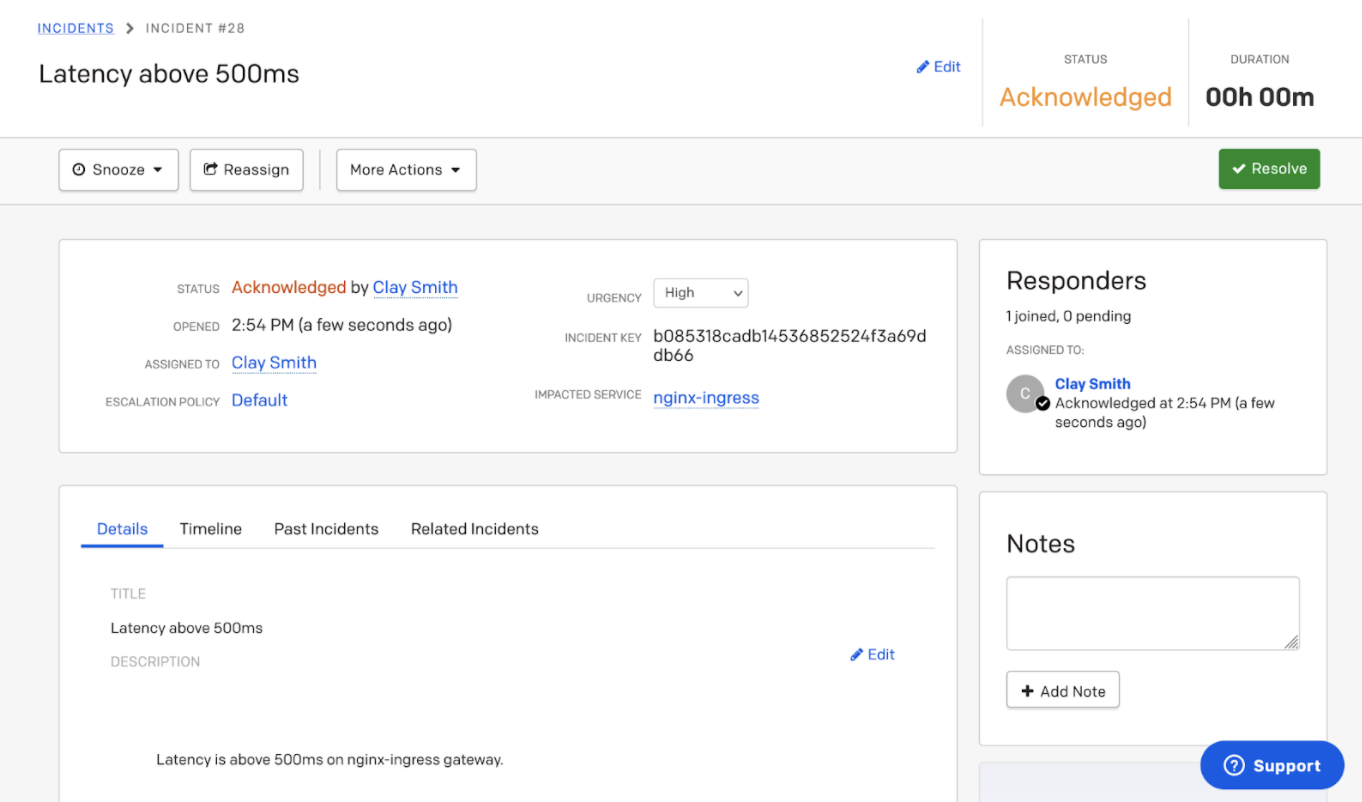
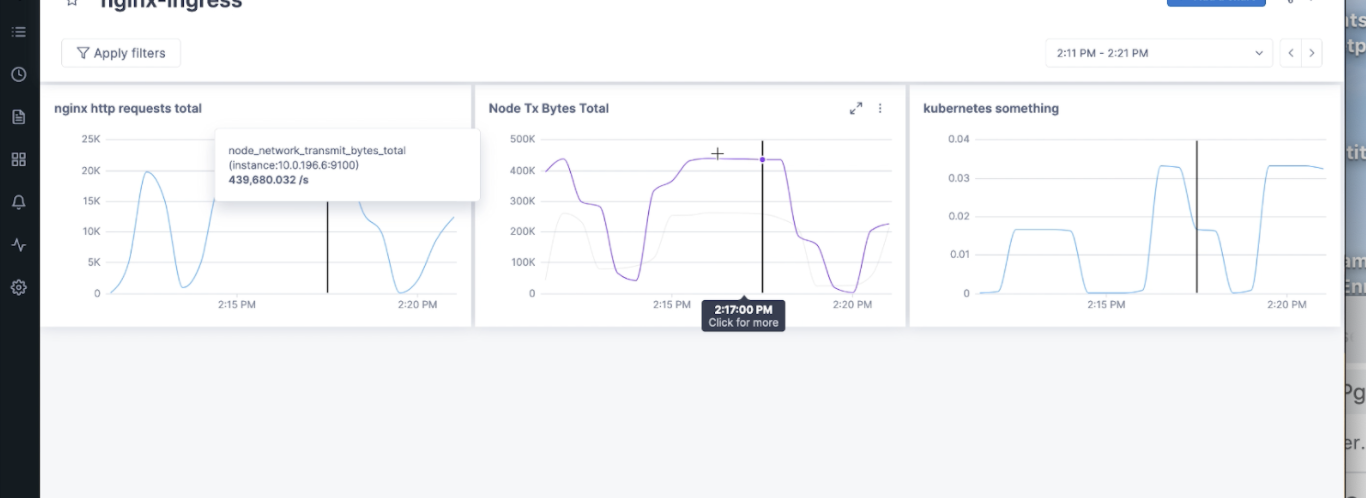
Step 1) Metrics Dashboard
Next up, we’ll jump into a Lightstep dashboard that shows some metrics collected for the nginx service with an active PagerDuty incident. Immediately, something doesn’t look quite right—there’s a suspicious spike. It’s a reasonable assumption to think that this spike indicates a problem worth investigating.
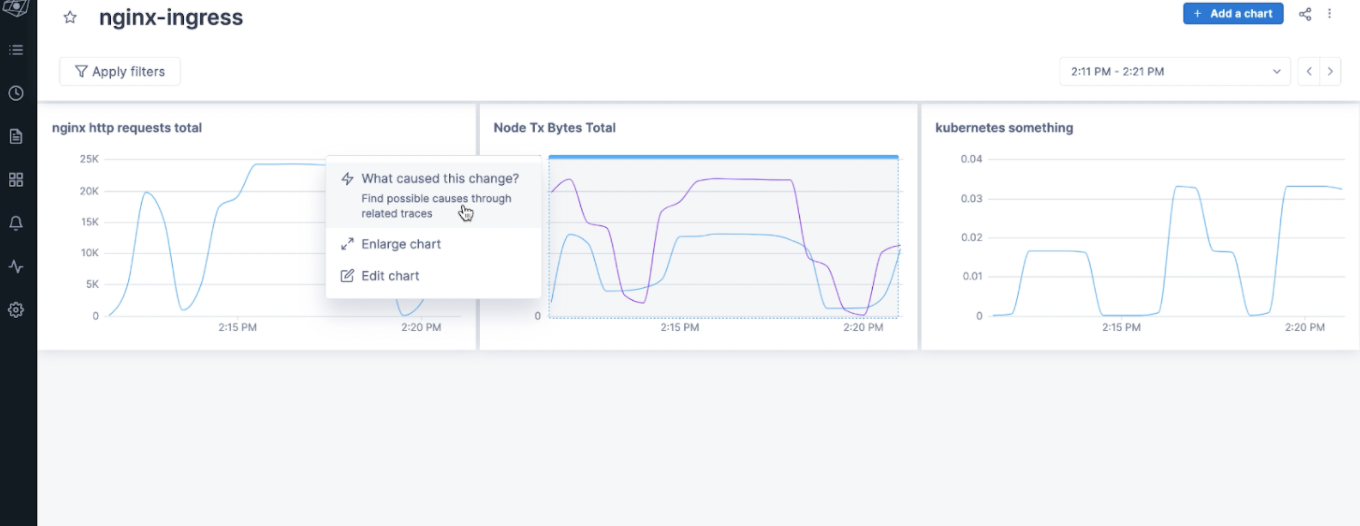
Step 2) Investigate Change
With just two clicks on the suspicious chart, you can access Lightstep change intelligence for analysis of all the metrics and traces to determine a best guess of what caused a suspicious spike in the chart.
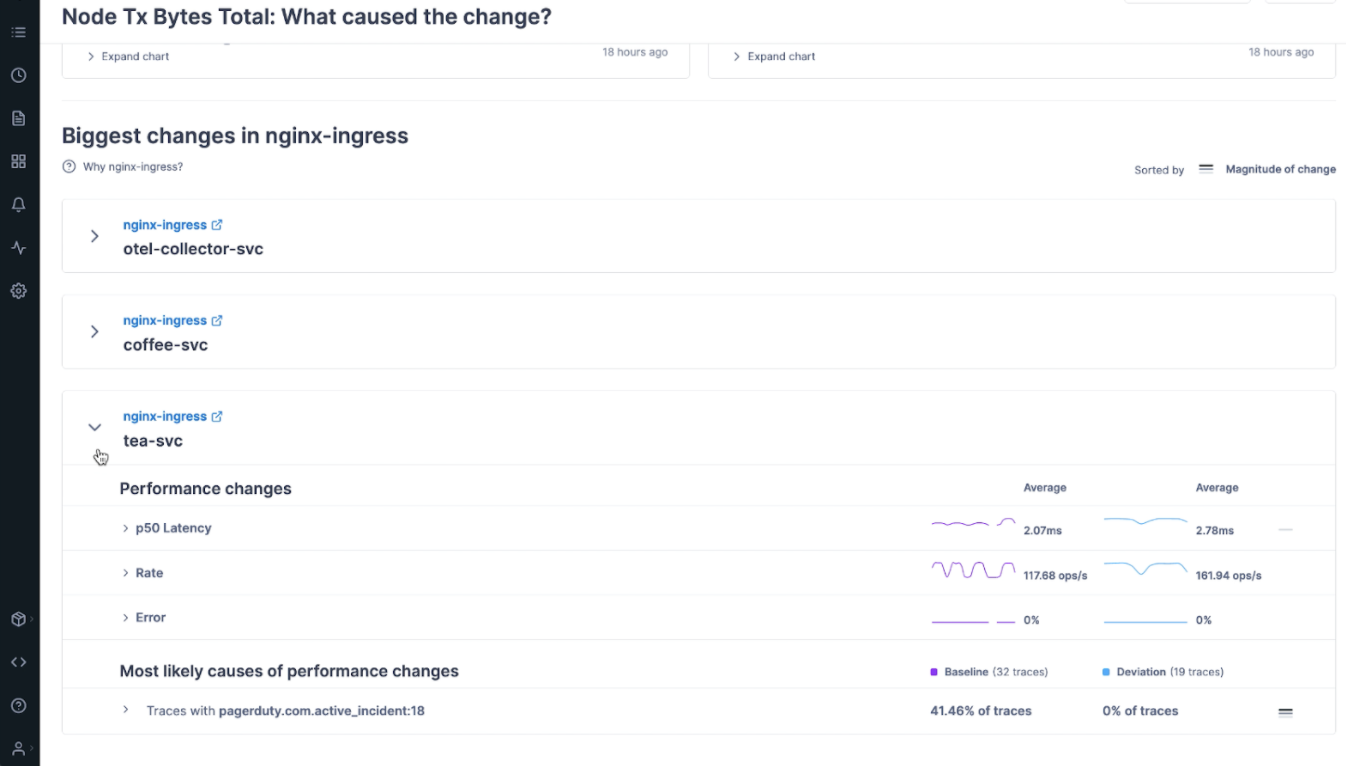
Step 3) Determine Root Cause
In change intelligence, Lightstep analyzes metrics and traces to determine possible causes of an ongoing incident. Lightstep can also consider performance changes in downstream services. With our custom OpenTelemetry collector, we can see the ongoing PagerDuty incident related to the service. This helps the responder know the metrics and traces they are looking at are connected to an ongoing incident:
Connecting telemetry to people
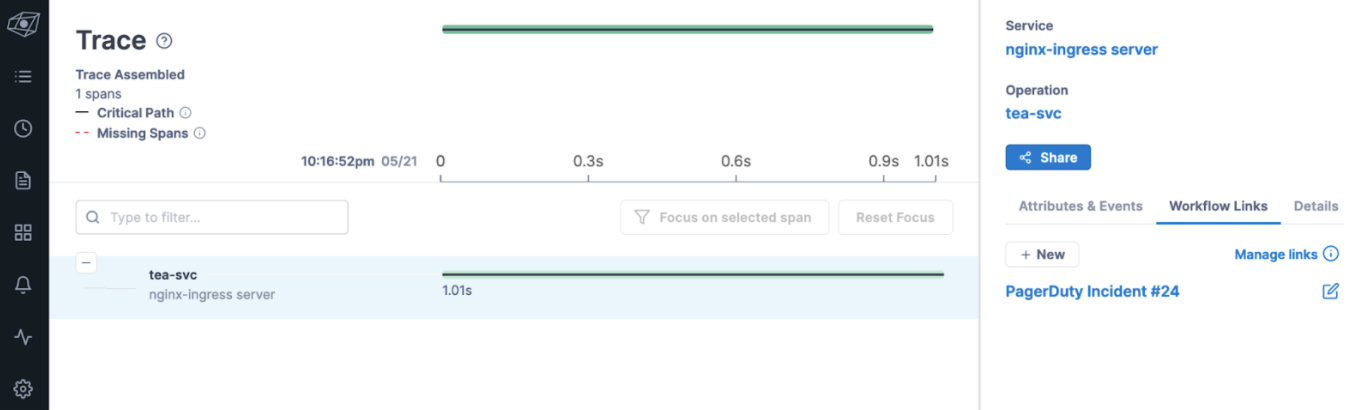
Our modified OpenTelemetry collector bridges the gap between technical performance data, service owners, and active incidents. Something abstract like CPU utilization or memory usage is now associated with an active PagerDuty incident, enabling faster and more efficient resolution. Using a link automatically added in Lightstep, it takes one click to jump back to the associated PagerDuty incident:
With PagerDuty incidents available via OpenTelemetry metrics and traces, post-mortem analysis becomes easier, too. It’s possible to configure Lightstep to store historical metrics and traces that are only collected when there is an active incident, helping teams understand how their service behaves during incidents that happened during the previous week or month.
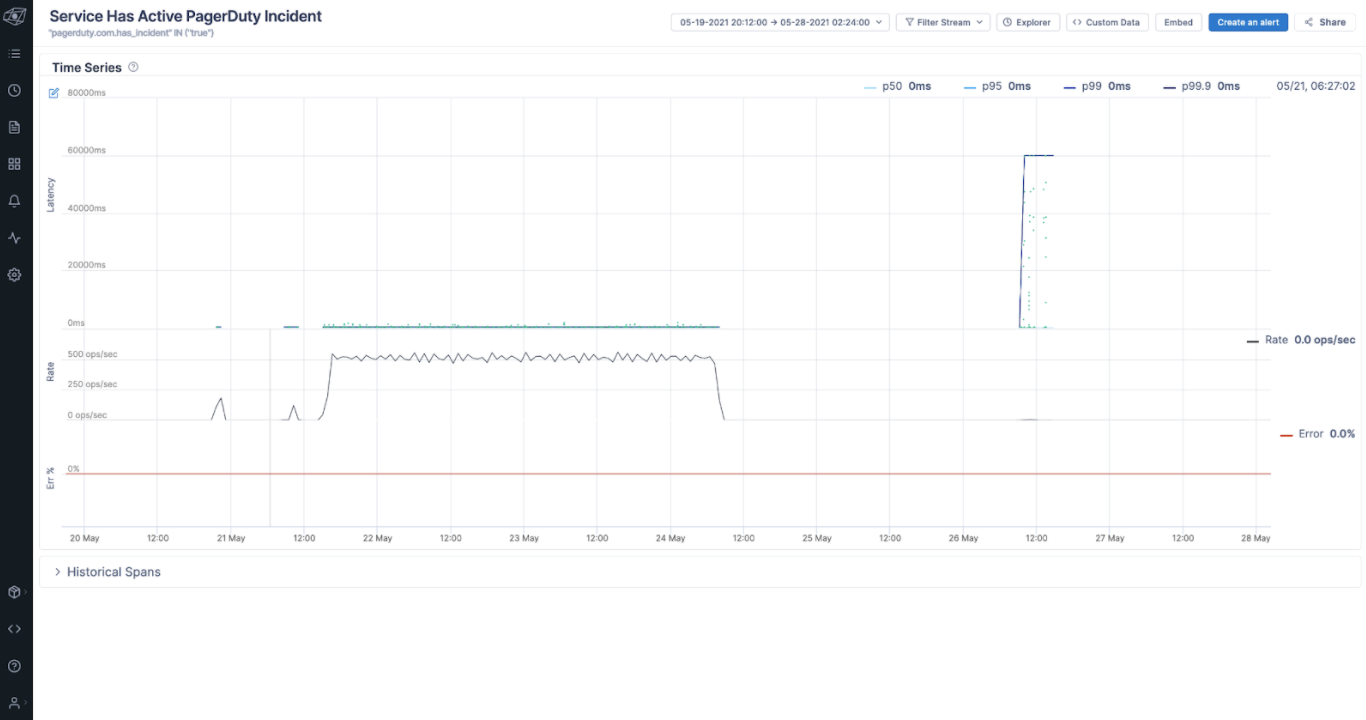
In the above screenshot, seeing no data indicates that there was no active incident. It’s a rare example of an empty dashboard being a good thing.
OpenTelemetry Unifies the DevOps Toolchain
The OpenTelemetry standard creates a foundation for best-of-breed technology to connect solutions. Even a simple breadcrumb of information—whether it’s about a PagerDuty incident, the current state of a feature flag, or a deployment version—connects one vendor’s product value to the entire development pipeline. With OpenTelemetry, this is done using open standards for automatic instrumentation of a customer’s code. Now, other products or even custom tooling can use this data as part of a productive developer workflow.