Start Using PagerDuty Today
Try PagerDuty free for 14 days — no credit card required.
Nagios XI expands upon the capabilities of the Nagios Core software to provide you with detailed host and service monitoring for your critical IT systems.
The guide below describes how to integrate your Nagios XI installation with PagerDuty using a simple Perl-based plugin. Note that you must be logged in as root to complete the installation. Please contact our support team if you have any trouble completing the integration.
Note: This guide has been replaced by the Nagios XI Two-Way Integration Guide that uses the PagerDuty Agent. Please try following the steps in the new integration guide first, and use this one only if you have a system which the PagerDuty Agent can not be installed on. Also be aware that the two-way integration script from the new integration guide can not be used with the Perl-based integration as-is; the two-way integration is only supported when using the new integration.
yum install perl-libwww-perl perl-Crypt-SSLeay
pagerduty_nagios.pl from GitHub and copy it to /usr/local/bin.
wget https://raw.github.com/PagerDuty/pagerduty-nagios-pl/master/pagerduty_nagios.pl
cp pagerduty_nagios.pl /usr/local/bin
chmod 755 /usr/local/bin/pagerduty_nagios.pl
nagios.cfg (found in /usr/local/nagios/etc if you’re using the virtual machine image provided by Nagios Enterprises).
enable_environment_macros=1
This step is required. The integration will not work if you do not have environment macros enabled.
nagios user’s cron table:
crontab -u nagios -e
* * * * * /usr/local/bin/pagerduty_nagios.pl flush
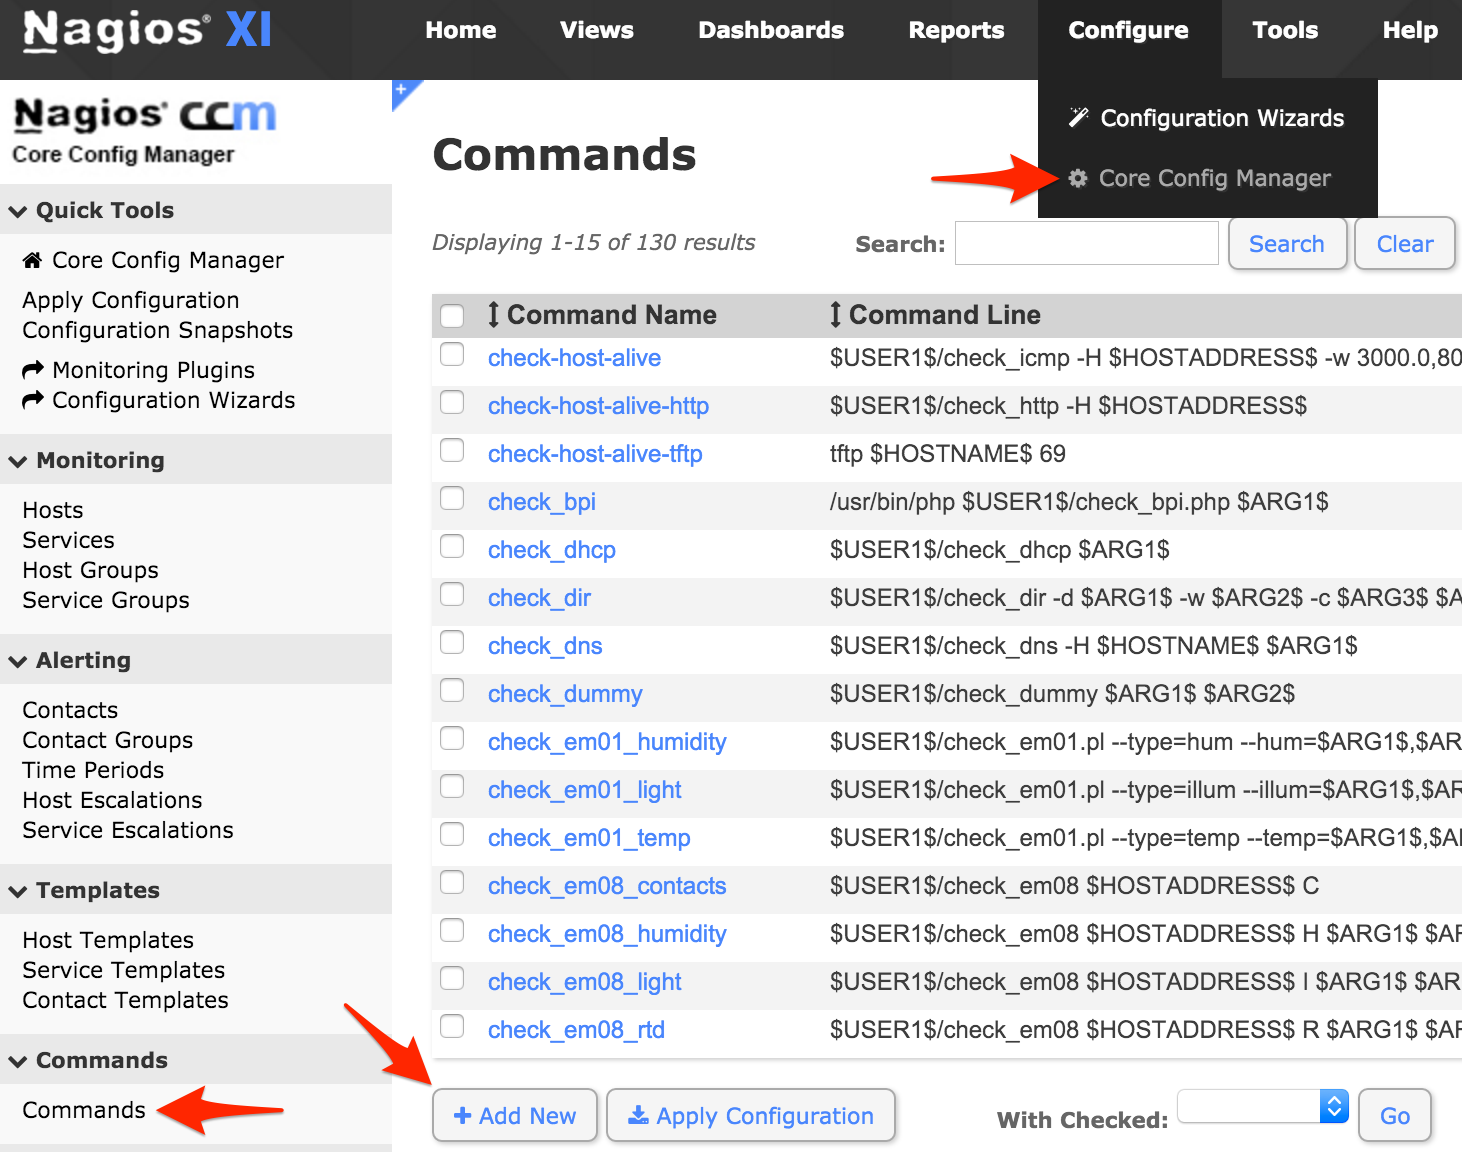
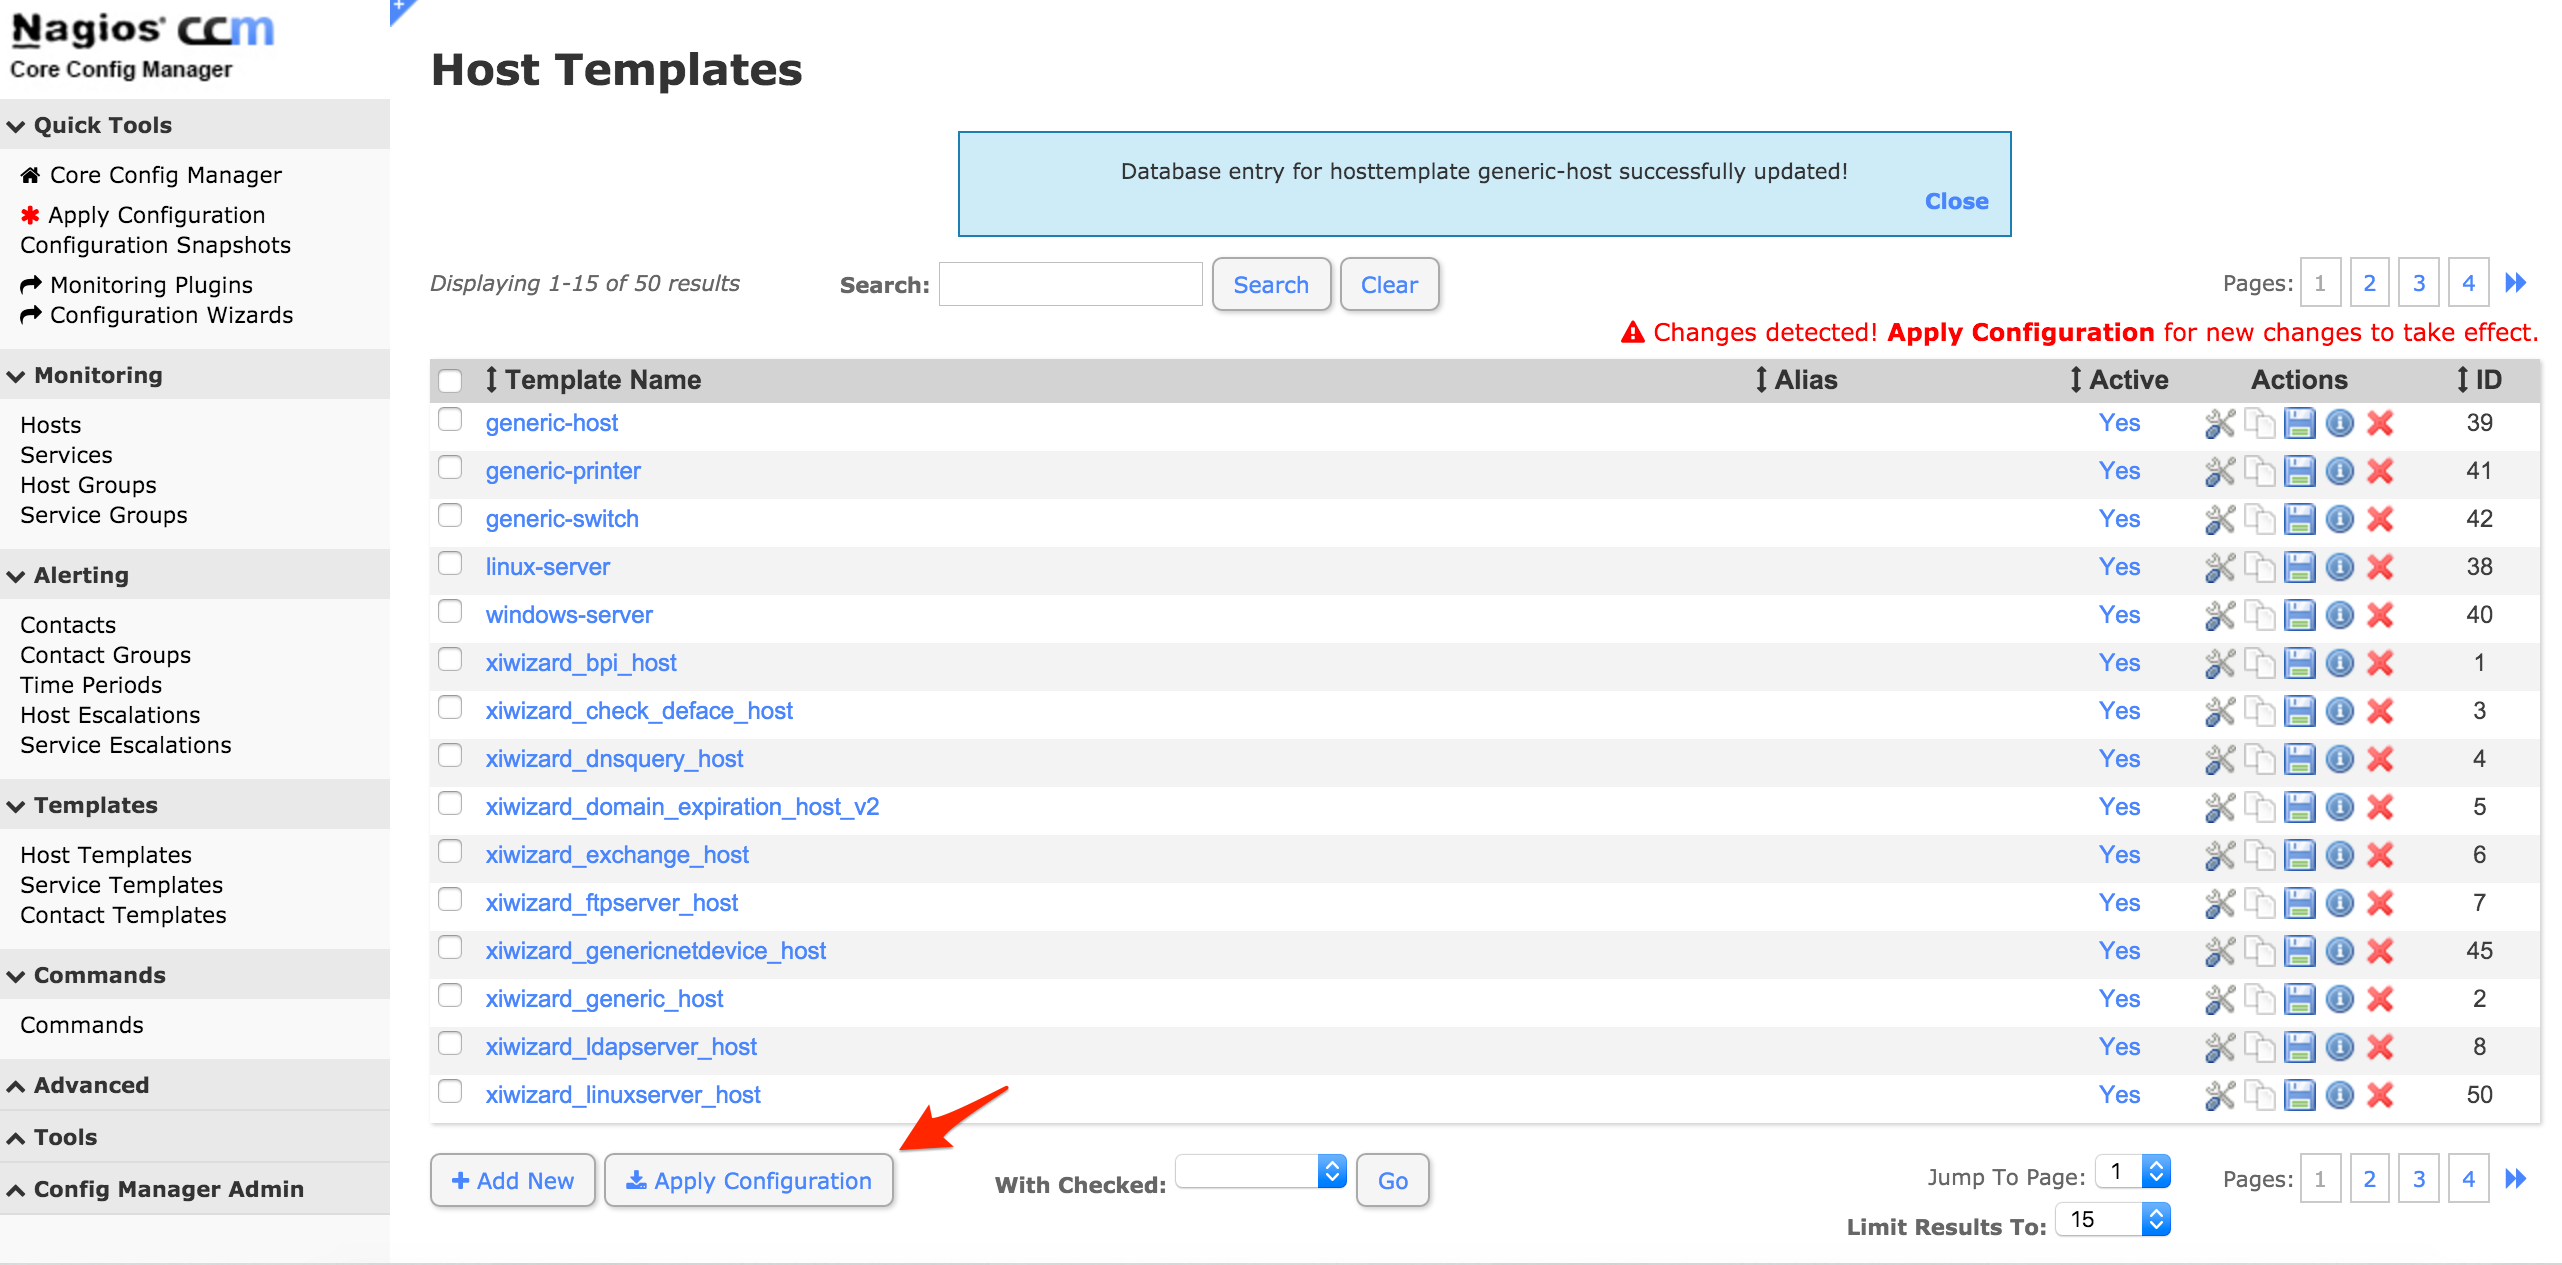
nagiosadmin, then go to the Configure menu and select Core Config Manager. Click Commands on the left menu, then click Add New.
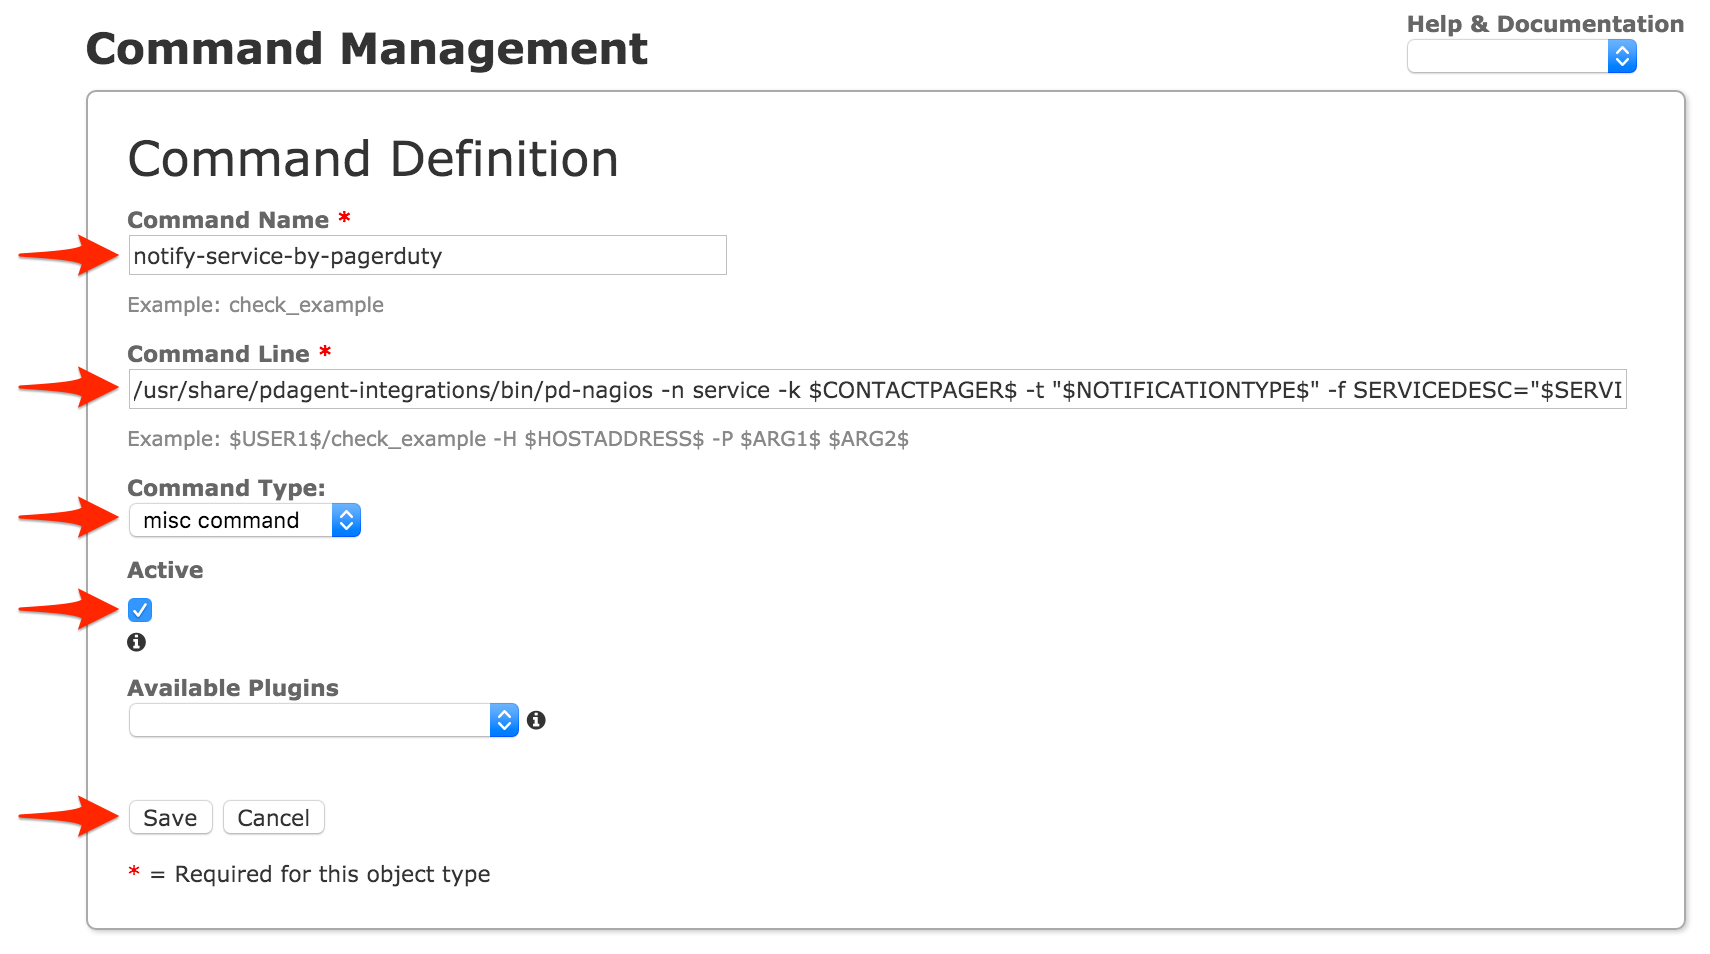
notify-service-by-pagerduty
/usr/local/bin/pagerduty_nagios.pl enqueue -f pd_nagios_object=service -f CONTACTPAGER="$CONTACTPAGER$" -f NOTIFICATIONTYPE="$NOTIFICATIONTYPE$" -f HOSTNAME="$HOSTNAME$" -f SERVICEDESC="$SERVICEDESC$" -f SERVICESTATE="$SERVICESTATE$"
misc command
notify-host-by-pagerduty
/usr/local/bin/pagerduty_nagios.pl enqueue -f pd_nagios_object=host -f CONTACTPAGER="$CONTACTPAGER$" -f NOTIFICATIONTYPE="$NOTIFICATIONTYPE$" -f HOSTNAME="$HOSTNAME$" -f HOSTSTATE="$HOSTSTATE$"
misc command
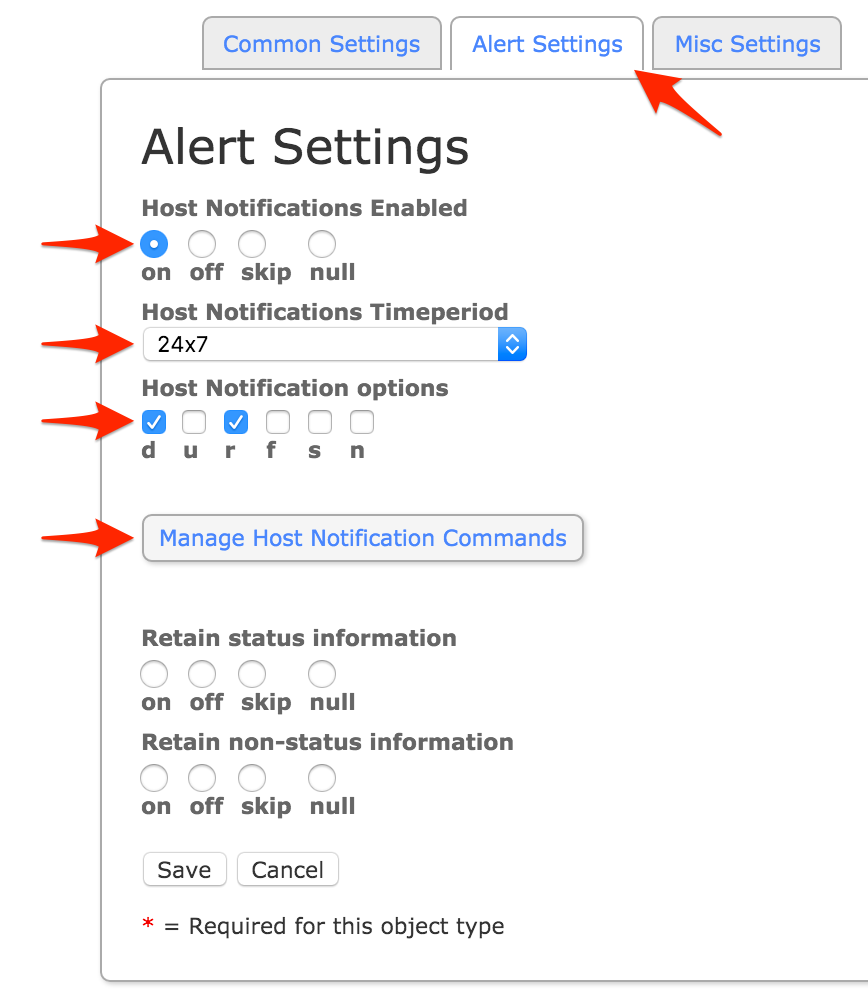
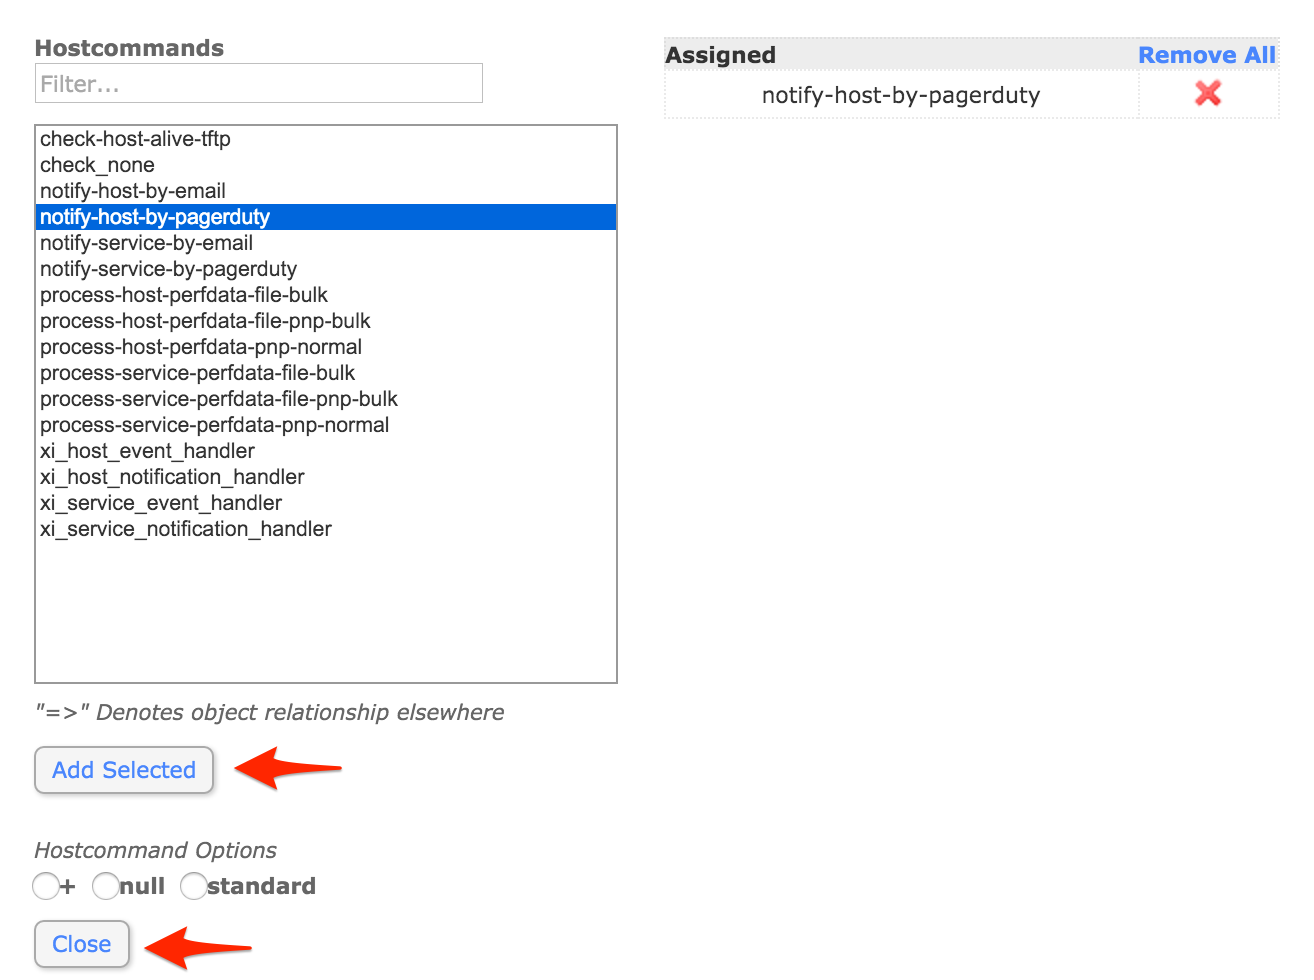
notify-host-by-pagerduty command and click Add Selected. Make sure that notify-host-by-pagerduty moves to the Assigned column, then click Close.
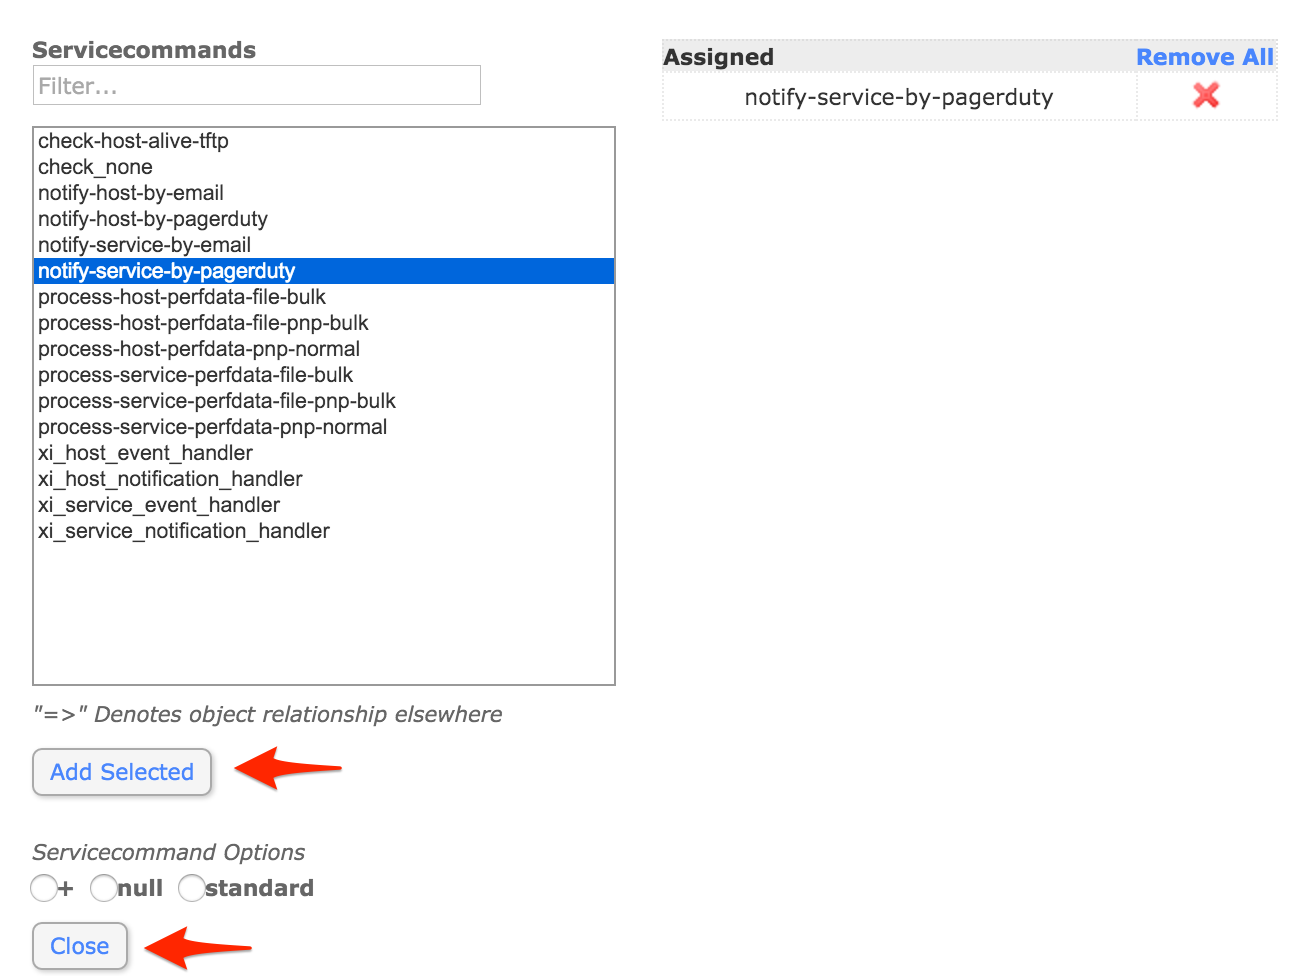
notify-service-by-pagerduty command and click Add Selected. Make sure that notify-service-by-pagerduty moves to the Assigned column, then click Close.
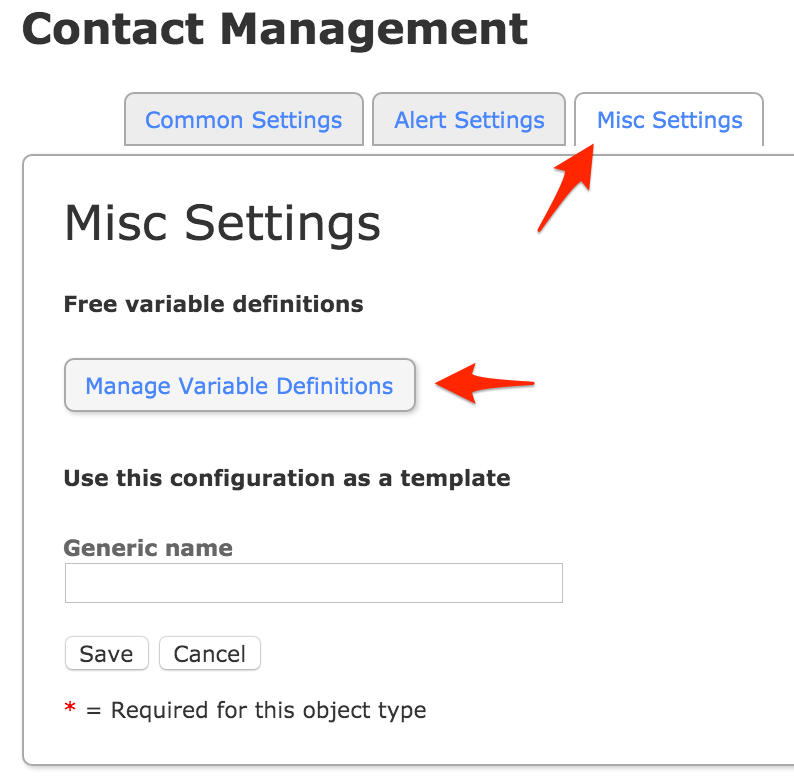
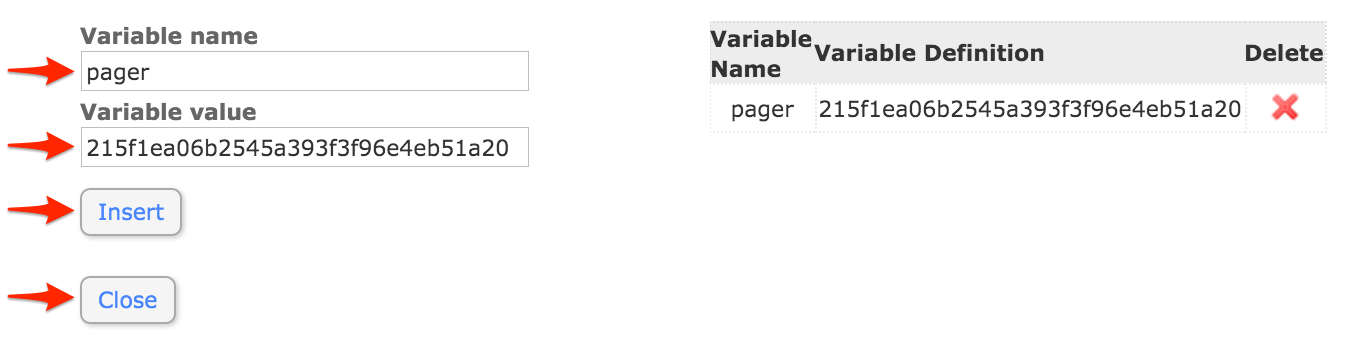
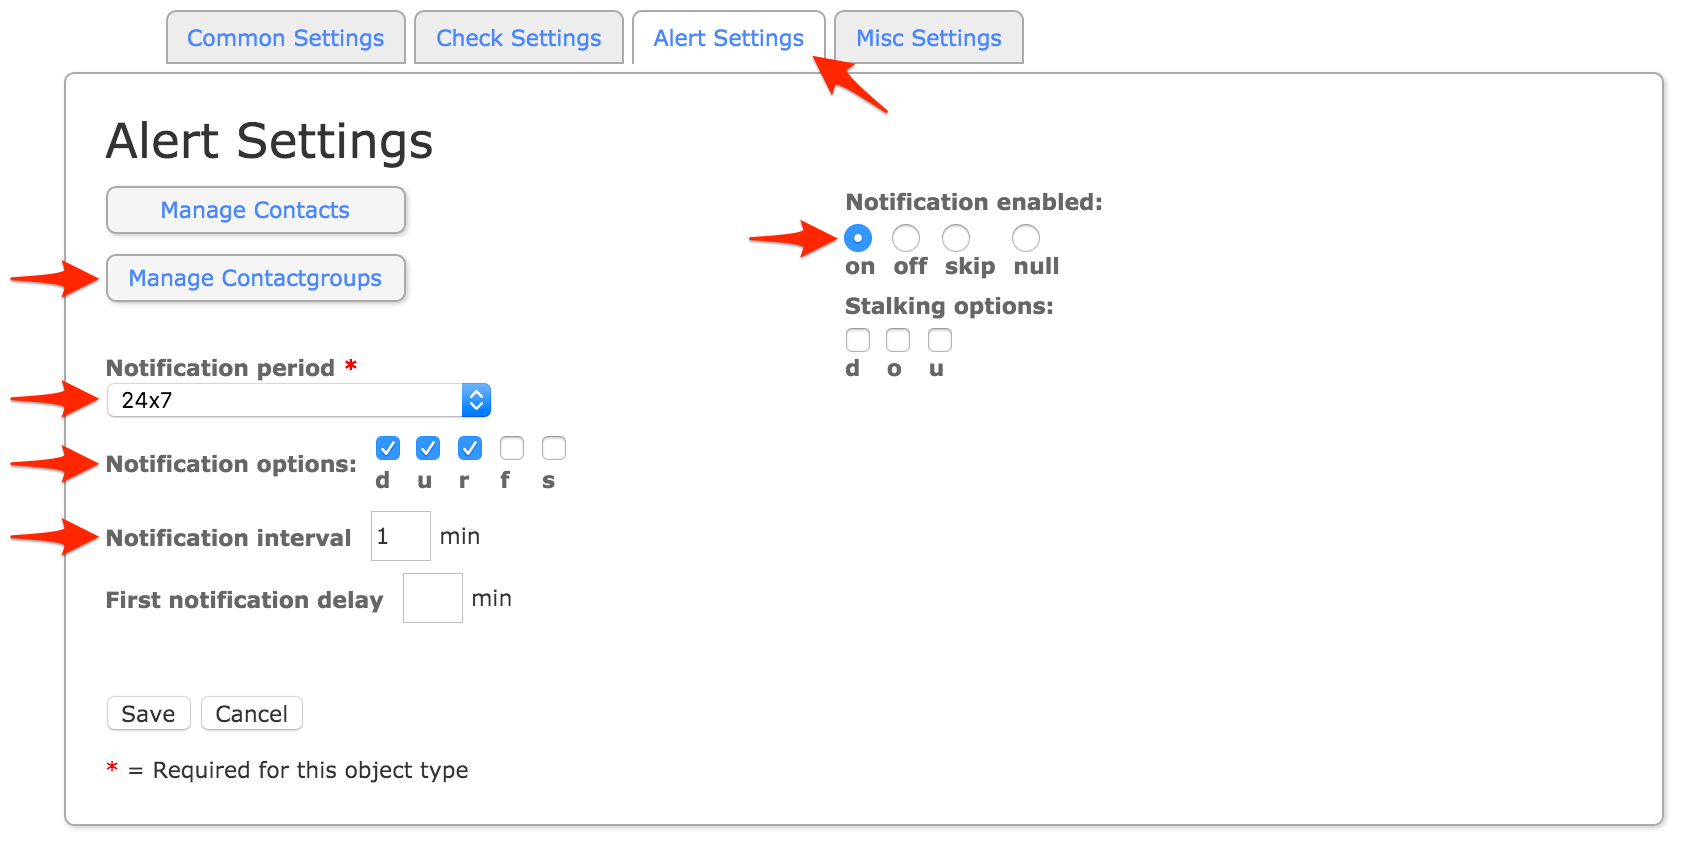
pager and Variable value to the Integration Key you copied from PagerDuty earlier and click Insert. Make sure that the variable is added to the right column, then click Close.
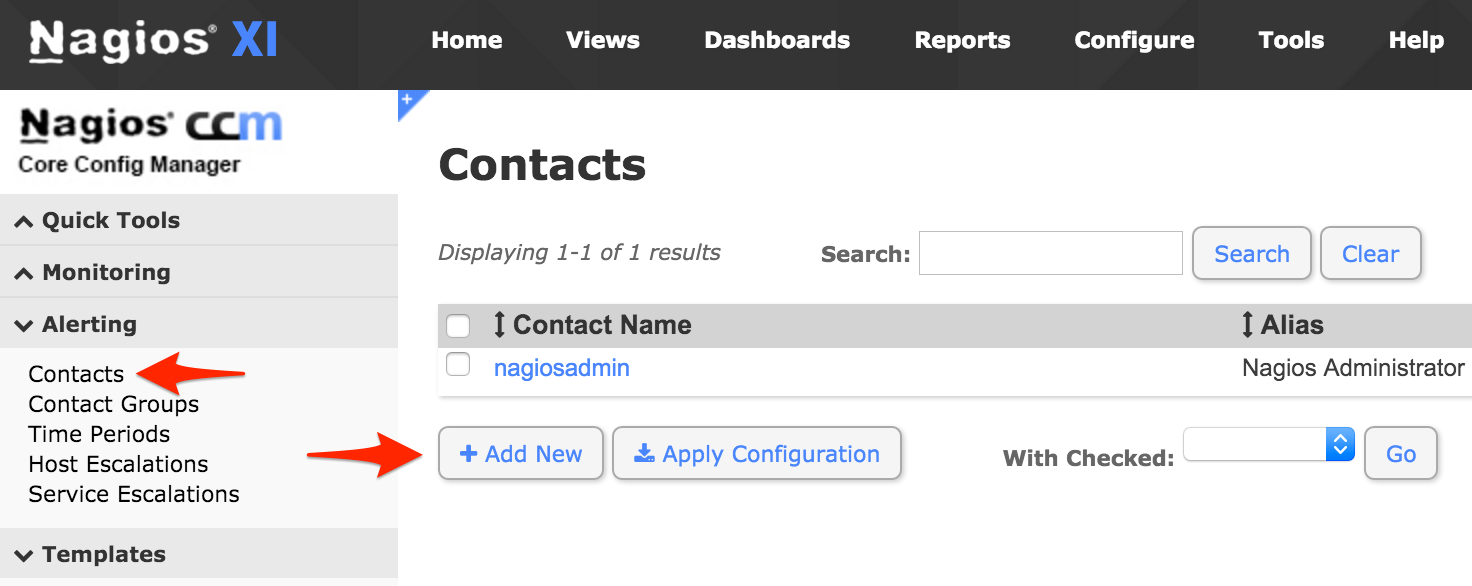
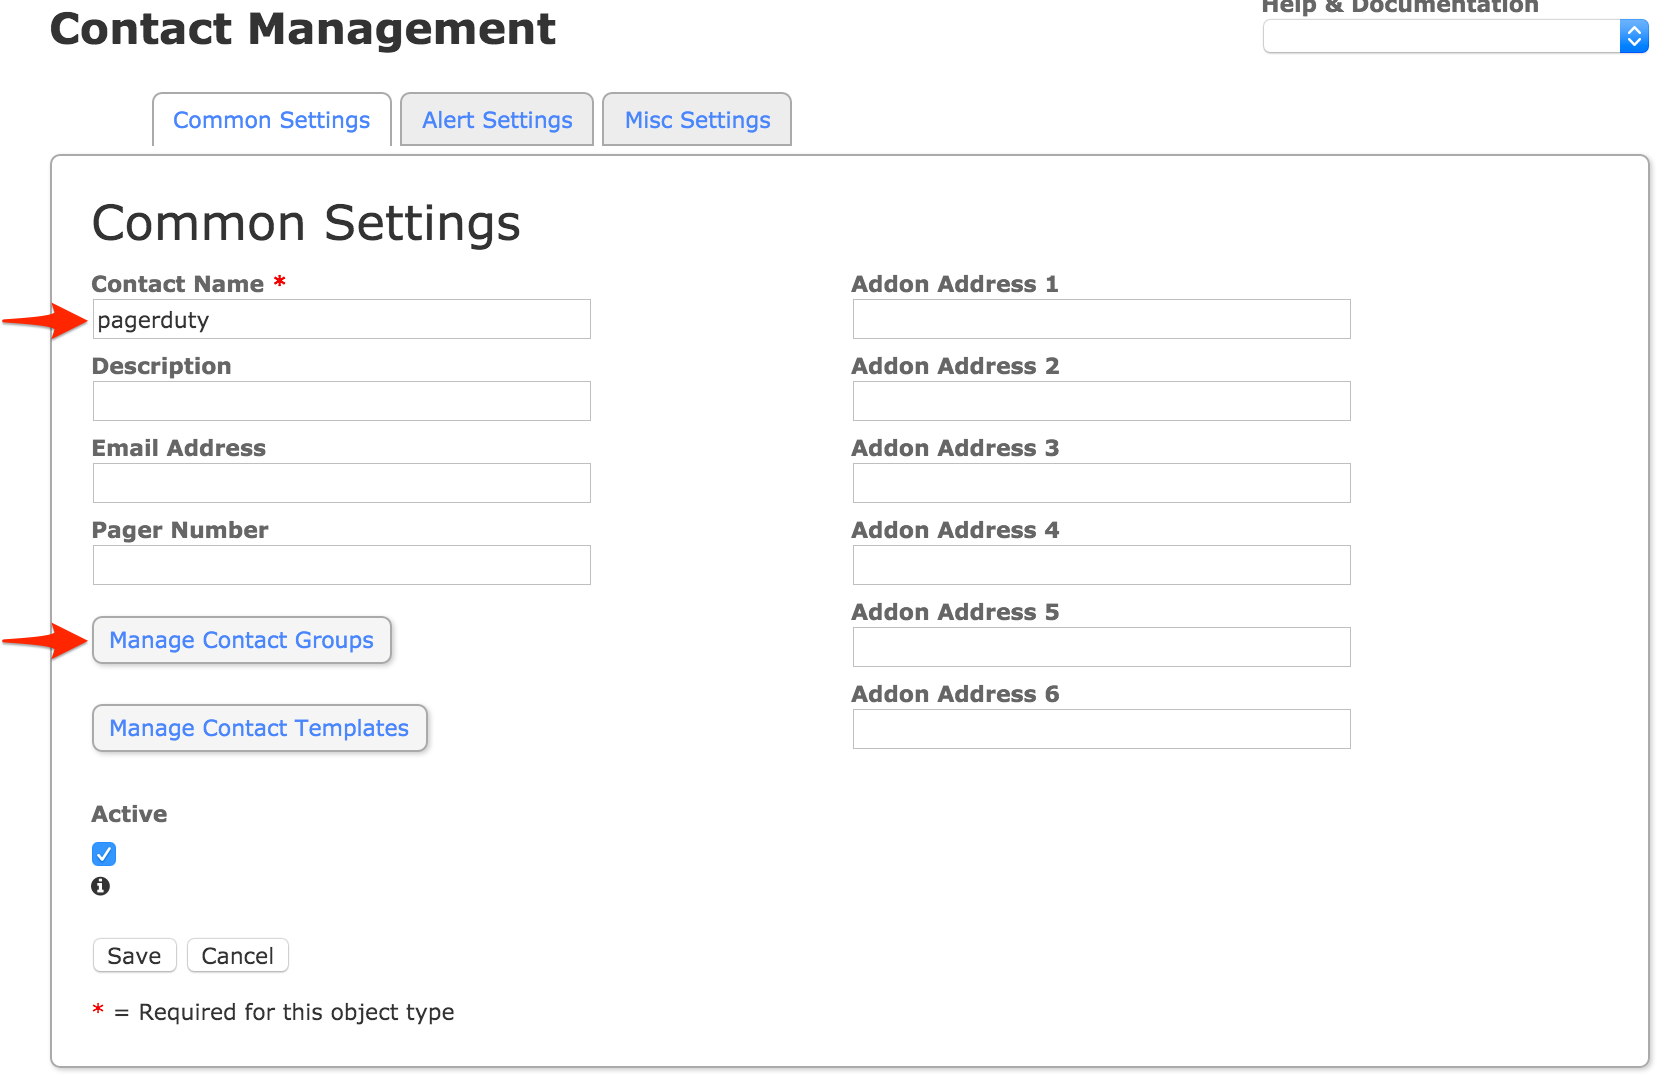
pagerduty, or if you wish to integrate with multiple PagerDuty services, more descriptive names such as pagerduty_database, pagerduty_network, etc.) then click Manage Contact Groups.
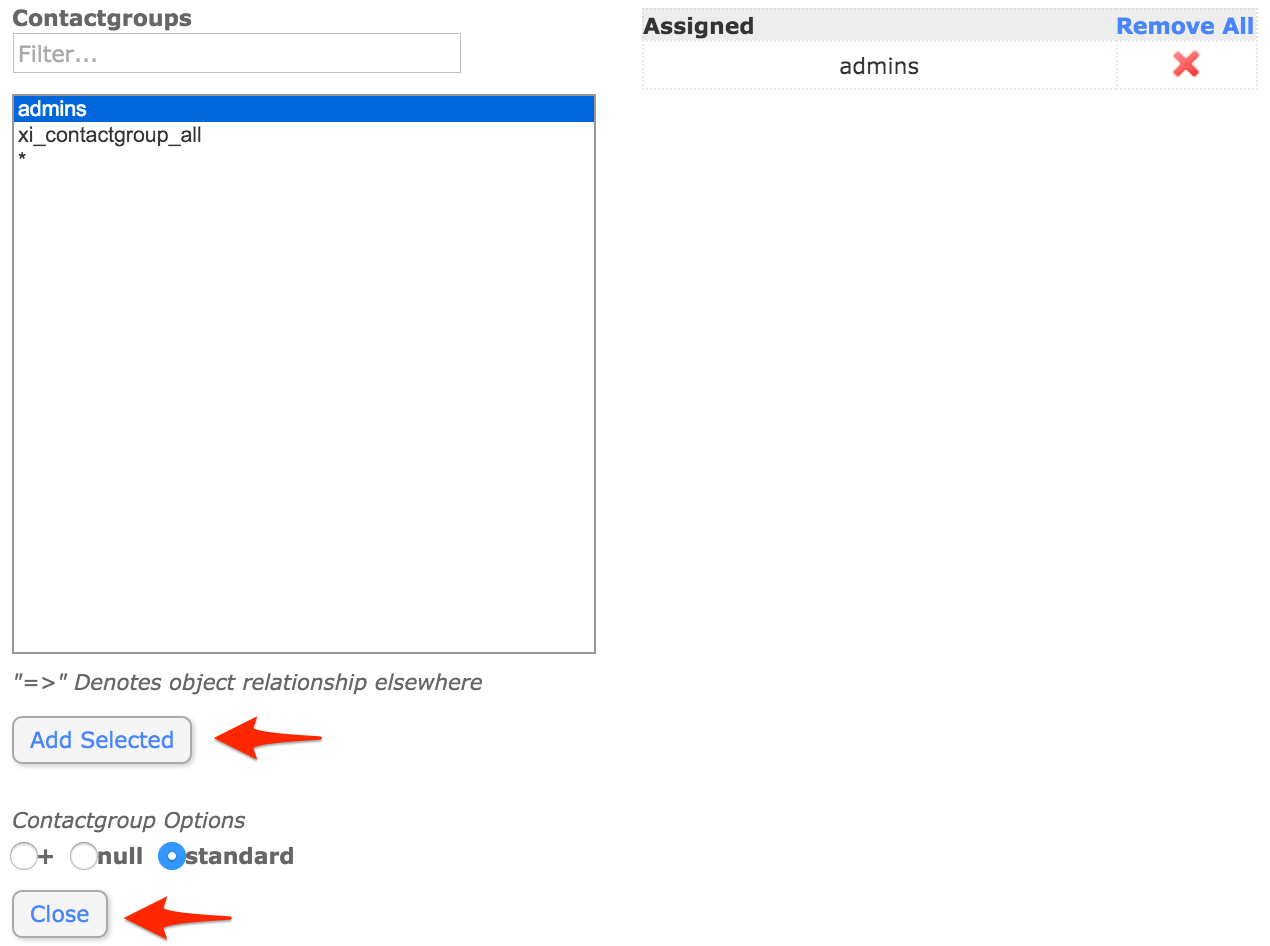
admins group, or another group you want the contact to be part of which your hosts and services will also be associated with, and click Add Selected. Make sure that admins (or your alternate group name) moves to the Assigned column, then click Close.
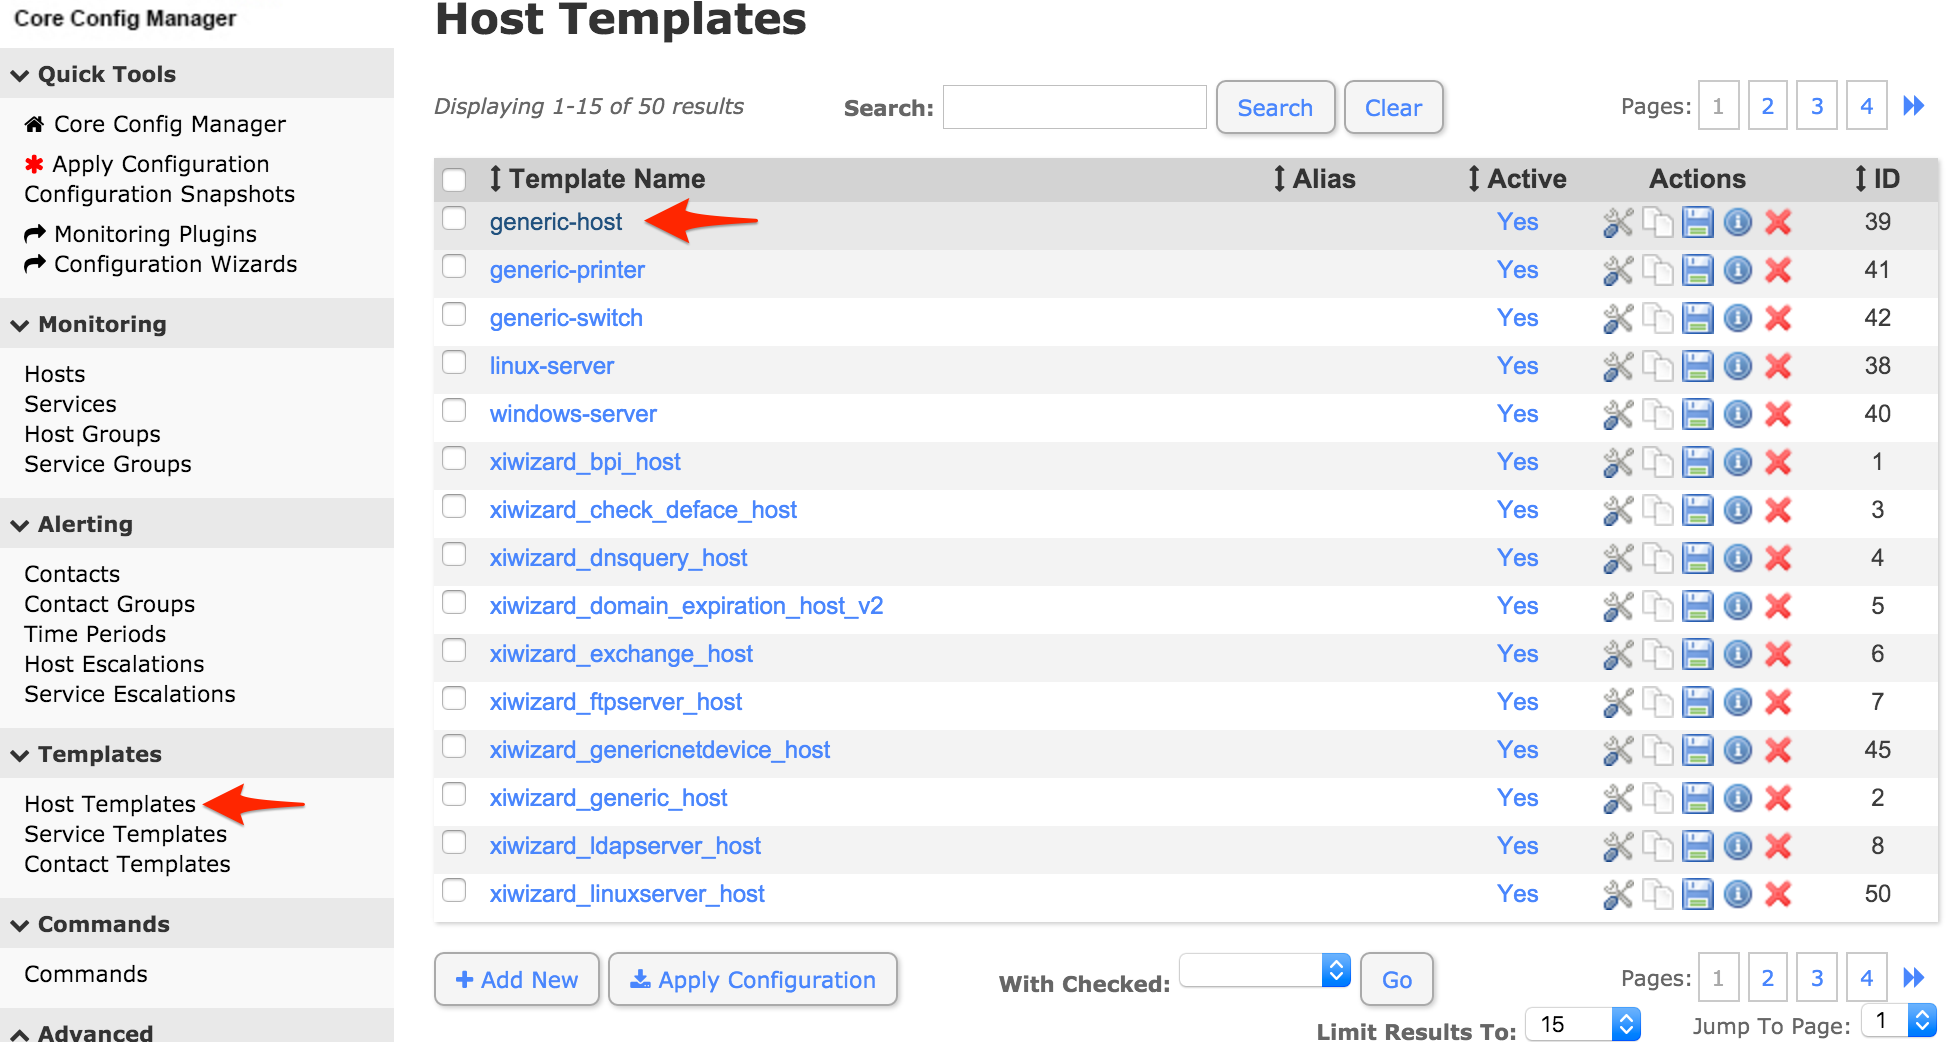
generic-host, as this will usually allow you to receive notifications for all hosts as soon as the integration process is complete.
admins group (or any alternative group you may have selected in step 15) and click Add Selected. Make sure that the group name moves to the Assigned column, then click Close.

This integration uses a Perl script which is compatible with older Linux distributions than the newer agent-based integration, however it lacks the two-way functionality of the new integration. You can not use the two-way script from the agent-based integration with the Perl script as-is; the two-way integration is only supported when using the new integration. For this reason, we recommend using the agent-based integration unless you are using a system which the agent is not compatible with (i.e. CentOS 5).
The Perl script works by adding events received from Nagios to a queue at /tmp/pagerduty_nagios. The script tries to flush the queue (send events to PagerDuty) immediately after receiving them from Nagios. If the script is unable to reach PagerDuty for any reason (i.e. due to connectivity issues), events are kept in the queue. The cron job exists to retry flushing the queue if there’s anything that hasn’t been sent.
The script has a few options you can set when executing it, including the ability to change the directory used for the queue or to set a proxy. The options are documented in the script. Note that you must set any options in both of the commands defined in your Nagios configuration as well as the cron job.
Tip: If you run in to issues with the integration and accumulate several events in the queue that you do not want to be sent to PagerDuty, simply remove the event files in /tmp/pagerduty_nagios to prevent them from being sent when the script is able to send alerts to PagerDuty successfully.
This is easy to do with the current integration, as a Nagios XI service in PagerDuty is directly mapped to a “contact” in Nagios. In order to configure multiple services, simply create additional contacts in Nagios XI with different names (i.e. pagerduty_database, pagerduty_network, etc.), then copy and paste the corresponding Integration Key from PagerDuty into the pager variable definition field, and make the contact part of a contact group which will receive notifications for your desired services. Don’t forget to apply your changes after saving your contact so they take effect.
If a PagerDuty server can’t be reached for any reason, events will be stored to an on-disk queue. The cron job will attempt to re-send the events once every minute.
You should configure an external ping check service such as StatusCake or NodePing to monitor your site’s external connectivity. Of course, you can use PagerDuty to receive alerts from these services as well.
Check that the pagerduty contact is getting the HOST or SERVICE NOTIFICATIONS in syslog. You can grep your syslog to see if the pagerduty contact is being notified. Here’s an example:
grep NOTIFICATION /var/log/messages
May 28 18:20:57 ip-10-11-139-249 nagios3: SERVICE NOTIFICATION: pagerduty;localhost;Current Users;CRITICAL;notify-service-by-pagerduty;USERS CRITICAL - 3 users currently logged in
As you can see, the pagerduty contact was notified for this SERVICE NOTIFICATION. If the pagerduty contact never shows up, that means that the pagerduty contact is not associated with notifications for the host/service in question. If you’re using the default configuration, make sure that the pagerduty contact is a member of the admins contact group.
More troubleshooting tips can be found in our Nagios Troubleshooting Guide.
PagerDuty can process PROBLEM, ACKNOWLEDGEMENT, and RECOVERY messages. All other messages, including FLAPPINGSTART and FLAPPINGSTOP, are ignored.
We have a guide for Customizing Notifications Sent to PagerDuty from Nagios to help you get started.
Try PagerDuty free for 14 days — no credit card required.