
What Major Incidents Really Cost Your Business
by PagerDuty
June 12, 2026
| 5 min read
When a major IT incident hits, most organizations know what it costs in the moment: lost transactions and missed SLAs. But according to the findings of our 2026 State of AI-First Operations report, the most significant consequences often don’t show up until long after the incident is closed—in customer relationships, team health, and brand reputation.
In this post, we break down the full liability picture of IT incidents—from the immediate costs that show up in quarterly reviews to the obligations that accumulate quietly long after recovery.
The disruption balance sheet framework
Most organizations approach incident cost the way an income statement approaches a bad quarter, asking, “What did we lose during the window of impact?” But that view only captures part of the exposure. A balance sheet approach asks a harder question: What liabilities does this incident create that we’ll still be carrying months from now?
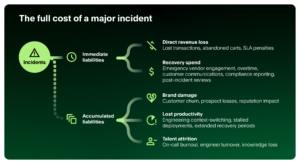
Immediate liabilities
These are the costs that show up in incident reports and quarterly reviews. They are measurable, immediate, and directly attributable to the incident.
Direct revenue loss
Our research found that more than two-thirds of organizations (68%) lose over $300,000 per hour when critical systems fail, and for 34%, that figure exceeds $500,000. At the extreme end, 8% report losses of $1 million or more per hour.
For an eCommerce platform, that could mean customers hitting error pages and completing their purchase elsewhere. A financial services firm might face transactions that can’t be processed and SLA penalties that trigger automatically.

Recovery spend
According to our report, half of organizations (50%) rank recovery and remediation costs—overtime pay, emergency fees, and emergency vendor engagement—among the greatest financial impacts of a major incident. And the work continues long after the incident is closed.
Organization-wide response efforts can pull engineers from roadmap work for hours or days. Customer communications need to be drafted and distributed. Compliance and regulatory reporting may be required. And once the incident is resolved, post-incident reviews consume additional time across multiple teams.

Accumulated liabilities
These are the costs that don’t always appear in the incident report. They’re slower to surface, harder to attribute to the original incident, and less quantifiable—but they matter just as much in the long term.
Brand damage and customer trust erosion
More than half of organizations (52%) identify brand and reputation damage as the most significant consequence of a major incident, ahead of every other financial impact.
Customers who experienced the incident may quietly evaluate alternatives. Prospects in active sales cycles might reconsider. New customer acquisition can become harder as reputation takes a hit in communities and review sites. By the time the damage shows up in revenue numbers, the connection to a specific incident can be difficult to make.

Lost productivity
Almost half of organizations (48%) cite lost productivity as a major consequence of IT incidents, often extending well beyond the incident window.
Engineers context-switch out of deep work to respond. Reviews, deployments, and roadmap work can stall. Teams may spend days in recovery mode before returning to full capacity. Because productivity loss is diffuse and hard to attribute to a single event, it rarely makes it into incident cost calculations.

Talent attrition and team burnout
Developer burnout is the fourth most-cited consequence of major incidents (42%), but its cost rarely makes it into post-incident reviews.
On-call fatigue can push experienced engineers toward organizations with healthier operational cultures. And when engineers do leave, the knowledge they take with them is rarely documented, let alone replaced.

How leading organizations are responding
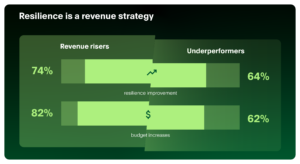
The good news is that operational resilience is improving across the board—71% of organizations report higher resilience and maturity than a year ago. And there’s a clear connection between stronger resilience and healthier bottom lines.
Revenue Risers—companies reporting revenue growth over the past 12 months—are significantly more likely to report improved resilience (74%) than organizations with flat or declining revenue (64%). These same companies are also investing in operational resilience more heavily, with 82% increasing budgets compared with 62% of underperformers.
The data also points to what’s driving those gains. More than half attribute improved resilience to platforms that support the full incident lifecycle (54%), tighter system integration (53%), and consolidating multiple tools into a single solution (51%). Nearly half (48%) have increased resilience by turning incidents into structured learning opportunities that strengthen future response.
Improving your balance sheet with PagerDuty
PagerDuty’s Operations Cloud connects over 750 integrations to orchestrate the full incident lifecycle with AI and automation, giving teams the visibility to detect, respond to, and learn from incidents.
PagerDuty’s purpose-built AI agents—including the SRE Agent, which can autonomously detect, triage, diagnose, and remediate issues before a human is ever paged—reduce the on-call burden that drives engineer burnout. The Scribe Agent and Insights Agent turn incidents into structured learning, strengthening future response.
According to a Forrester Total Economic Impact Study, PagerDuty customers see 249% ROI within year one, 59% fewer service disruptions, and 50% fewer incidents.
To see the full data on how leading organizations are turning operational resilience into a competitive advantage—and how PagerDuty can help you do the same—download the 2026 State of AI-First Operations report.