- PagerDuty /
- Integrations /
- Geneos Integration Guide
Geneos Integration Guide
ITRS Geneos is an Application Performance Monitoring(APM) solution for the “Always on Enterprise”. With the Geneos integration for Pagerduty, you can turn any real-time event into an PagerDuty Incident for triage and notification. From your Geneos Active Console, you can also view any filter of open Incidents in PagerDuty to keep track of your businesses critical services.
In PagerDuty
- Go to the Services menu and select Service Directory.
- On the Service Directory page:
- If you are creating a new service for your integration, click +New Service.
- If you are adding your integration to an existing service, click the name of the service you want to add the integration to. Then click the Integrations tab and click Add a new integration.
- Select your app from the Integration Type menu.
- Enter an Integration Name. If you are creating a new service for your integration, in General Settings, enter a Name for your new service. Then, in Incident Settings, specify the Escalation Policy, Notification Urgency, and Incident Behavior for your new service.
- Click the Add Service or Add Integration button to save your new integration. You will be redirected to the Integrations page for your service.
- Copy the Integration Key for your new integration and keep it in a safe place for later use.
In Geneos
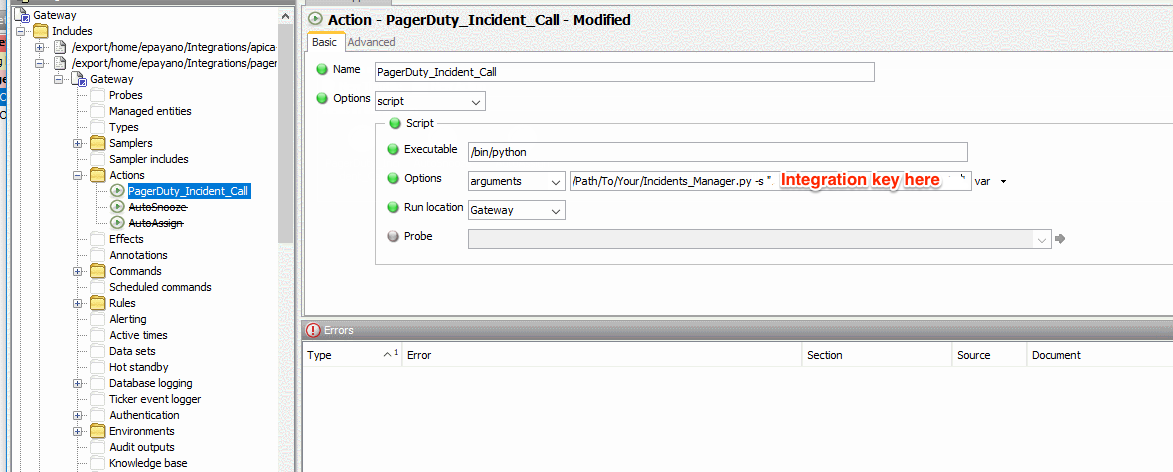
You may need to FTP the script. Just be sure to have the script somewhere that is accessible on the server for your Gateway to execute.
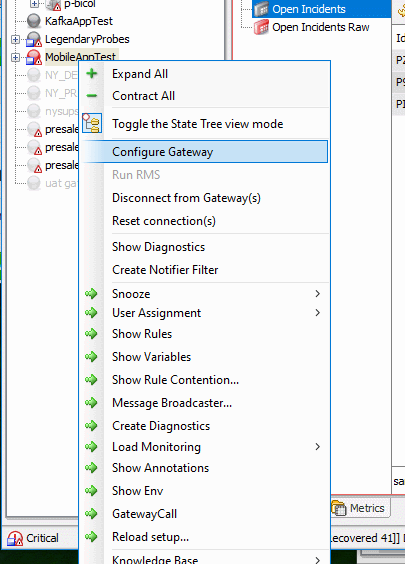
- Right click on the desired gateway for your script, and click on Configure:
- Create an action, then configure your path to the script. Here you can supply PagerDuty’s Integration Key as a command-line option.
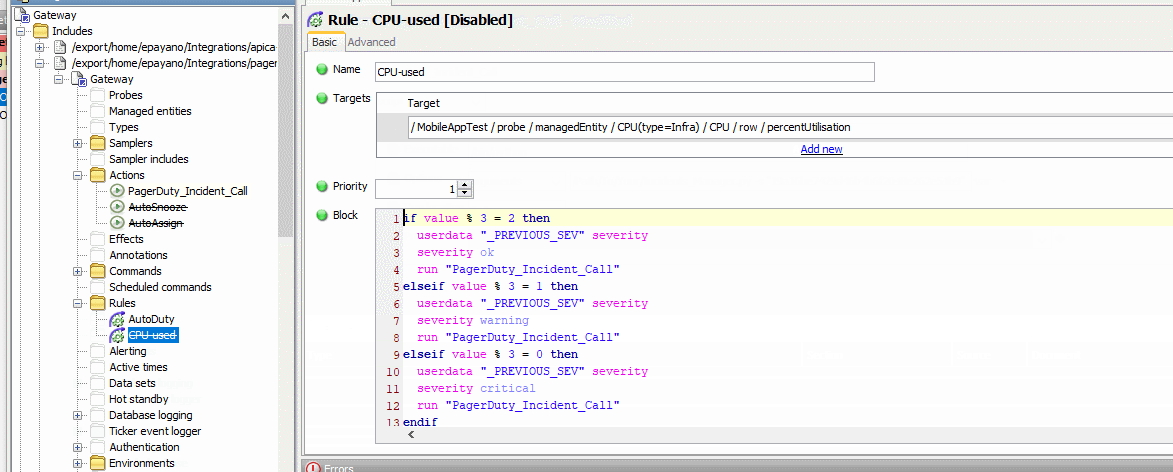
- Finally, apply it to a rule where you would like to execute the integration from.
Testing the Integration
To test the integration, right click on any cell in Geneos, select PagerDuty from the menu, and click Trigger. A JSON prompt will pop up that says Incident Created at the top, in the payload will have:
{
"status":"success",
           "message":"Event processed",
           "dedup_key":"your_dedup_key_here"
}
You can see incidents in Geneos that were manually triggered in PagerDuty by navigating to Pagerduty → Open Incidents in Geneos.
FAQ
What features does this integration include?
This integration includes Application Performance Management (APM), Infrastructure Monitoring, Log Management, Status/Dashboards, and Web Monitoring.
When an incident gets triggered in PagerDuty, what kind of information can I see about the Geneos event?
When looking at a Geneos-triggered incident in Pagerduty, you will be able to view a variety of information in the details of the incident, including user time percentage, wait time percentage, system type, system name, host name, and many other pieces of information.
Ready to get started?
Try any product on the Operations Cloud for free.
No credit card required.