- PagerDuty /
- Integrations /
- Datadog Add-on Guide
Datadog Add-on Guide
Datadog screenboards are powerful dashboards for your incident metrics. By bringing these dashboards straight into PagerDuty, you can view your incident metrics alongside your incident management dashboard. This will allow you to both manage and analyze your incidents in one centralized location.
Single-Page Dashboards
In Datadog
- Navigate to a dashboard that you want to include in PagerDuty.
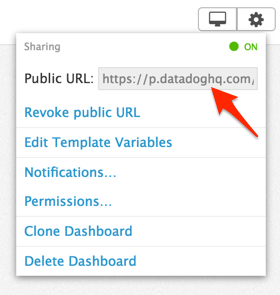
- Click the cog icon in the top right.
- In the drop-down menu, select Generate Shared URL and copy the URL.
In PagerDuty
- Navigate to Integrations → Extensions.
- Click the Add-Ons tab and click + New Add-on.
- Enter a Name for your add-on, choose It's Own Page, and paste the URL you copied in step 3 above.
- Click Save.
Incident Dashboards
In Datadog
- Navigate to the dashboard you want appended to incidents.
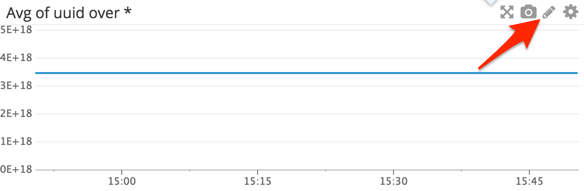
- Click on the edit pencil button of the metric you want to append to incidents.
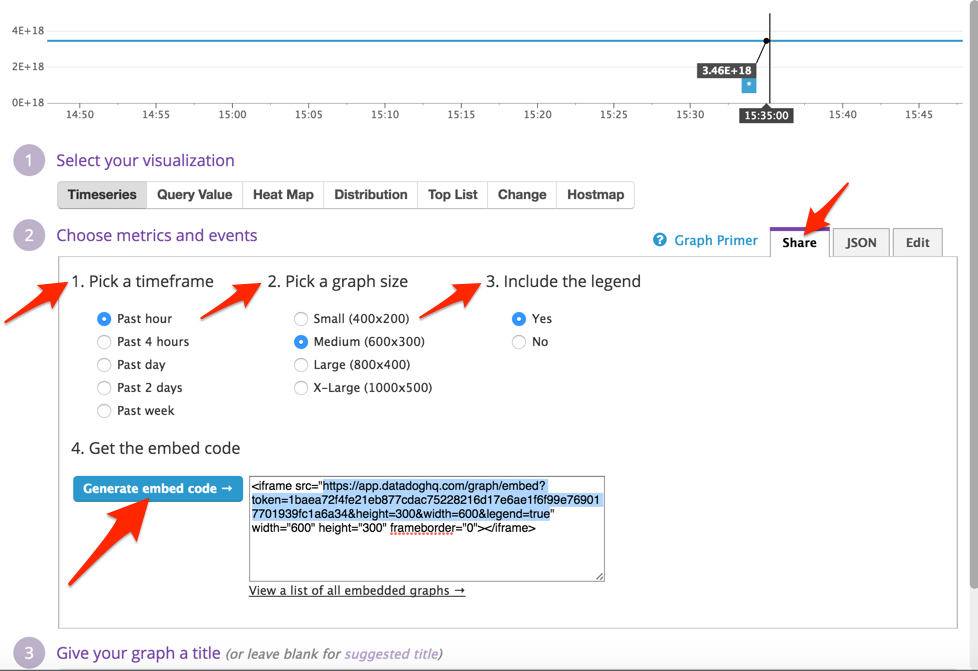
- Select the Share tab.
- Pick a timeframe, graph size, and choose whether or not to include the legend. We recommend using the Medium size for the best visibility across mobile and desktop web.
- Click Generate embed code.
- Copy the src attribute value to your clipboard.
In PagerDuty
- Navigate to Integrations → Extensions.
- Select the Add-Ons tab and click New Add-On.
- Enter a Name for your add-on, select Add this to incidents on a service, select your service, and paste the URL you copied from the src attribute in step 6 above.
- Click Save.
FAQ
Is there any way to update a dashboard from PagerDuty?
No, the public URLs for Datadog dashboards are read-only. To update a dashboard you must make the edits within Datadog.
I added my dashboard as an add-on but nothing is loading on the page
Ensure that the public URL for the dashboard is accessible by going directly to the URL in your browser. If you can load the dashboard within your browser, it should be loading within PagerDuty as well. If you are experiencing this issue, please contact our Support Team for assistance resolving this issue.
Will these dashboards be available for our mobile users?
While single-page dashboards will not be available via the mobile app, incident dashboards will be available when viewing your incidents. On each incident, your mobile users will see a link to the Datadog add-on for this incident. Clicking on this link will open the Datadog scoreboard within the default web browser on their mobile phones.
Can I add more than one timecard to my incidents?
Yes, you can add multiple add-ons to a particular service and all of these add-ons will appear within the details of the incidents triggered on this service.
Ready to get started?
Try any product on the Operations Cloud for free.
No credit card required.