- PagerDuty /
- Integrations /
- InfluxData Integration Guide
InfluxData Integration Guide
InfluxData is a leading time-series platform for handling all time series data, from humans, sensors, or machines—seamlessly collecting, storing, visualizing, and turning insight into action. Users can configure a notification endpoint to be used with InfluxDB 2.0 OSS and the InfluxDB Cloud 2.0 Usage-based Plan. Users on InfluxDB 1.x versions need to configure Kapacitor to send alerts to PagerDuty. This integration uses the Events V2 API.
In PagerDuty
- Go to the Configuration menu and select Services.
- On the Services page:
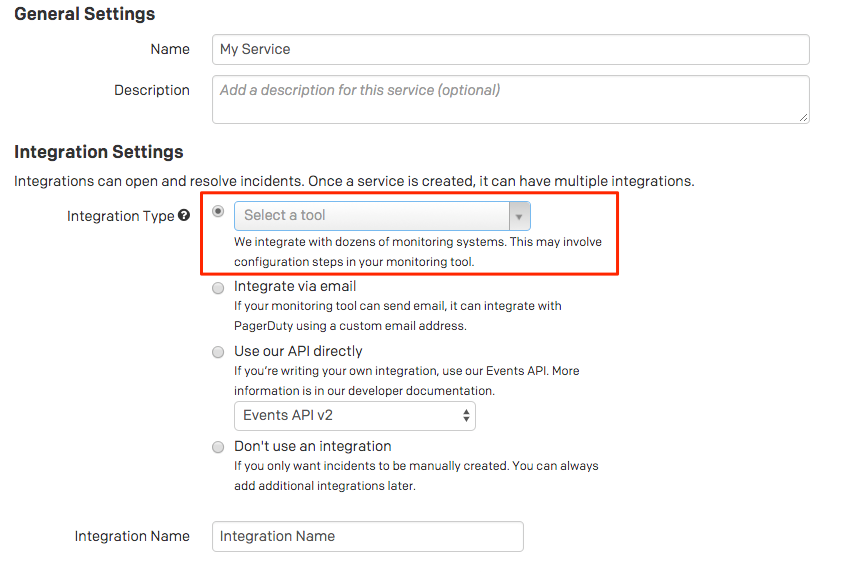
- If you are creating a new service for your integration, click Add New Service.
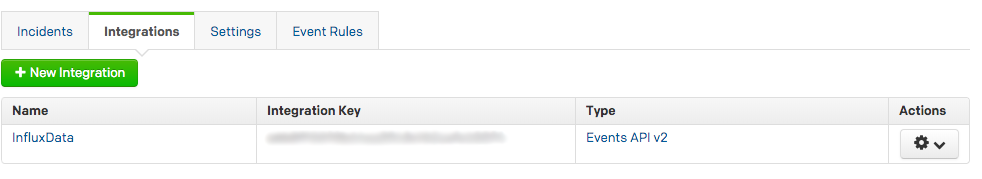
- If you are adding your integration to an existing service, click the name of the service you want to add the integration to. Then click the Integrations tab and click the New Integration button.
- Click Use our API directly and ensure Events API v2 is selected
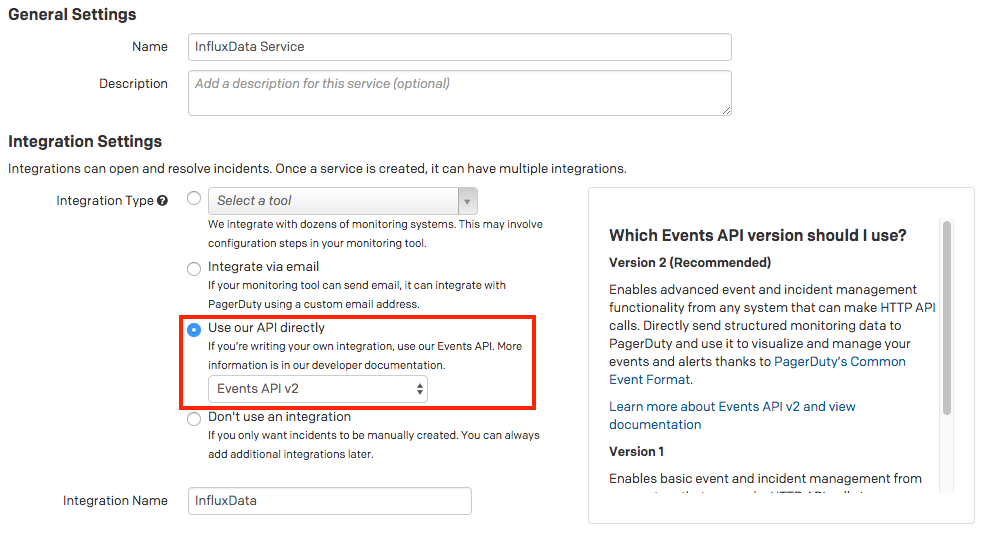
- Enter an Integration Name. If you are creating a new service for your integration, in General Settings, enter a Name for your new service. Then, in Incident Settings, specify the Escalation Policy, Notification Urgency, and Incident Behavior for your new service.
- Click the Add Service or Add Integration button to save your new integration. You will be redirected to the Integrations page for your service.
- Copy the Integration Key for your new integration.

In InfluxData
Configure Notification Endpoints (InfluxDB 2.0)
- Select the Monitoring and Alerting icon from the sidebar.
- Next to Notification Endpoints, click Create.
- From the Destination drop-down list, select PagerDuty as the destination endpoint to send notifications.
- In the Name and Description fields, enter a name and description for the endpoint.
- Enter the PagerDuty Integration Key from above in the Routing Key field.
- The Client URL provides a useful link in your PagerDuty notification. Enter any URL that you’d like to use to investigate issues. This URL is sent as the
client_urlproperty in the PagerDuty trigger event. By default, the Client URL is set to your Monitoring & Alerting History page, and the following included in the PagerDuty trigger event:"client_url": "https://us-west-2-1.aws.cloud2.influxdata.net/orgs/<your-org-ID>/alert-history” - Click Create Notification Endpoint.
Configure Kapacitor (InfluxDB 1.x)
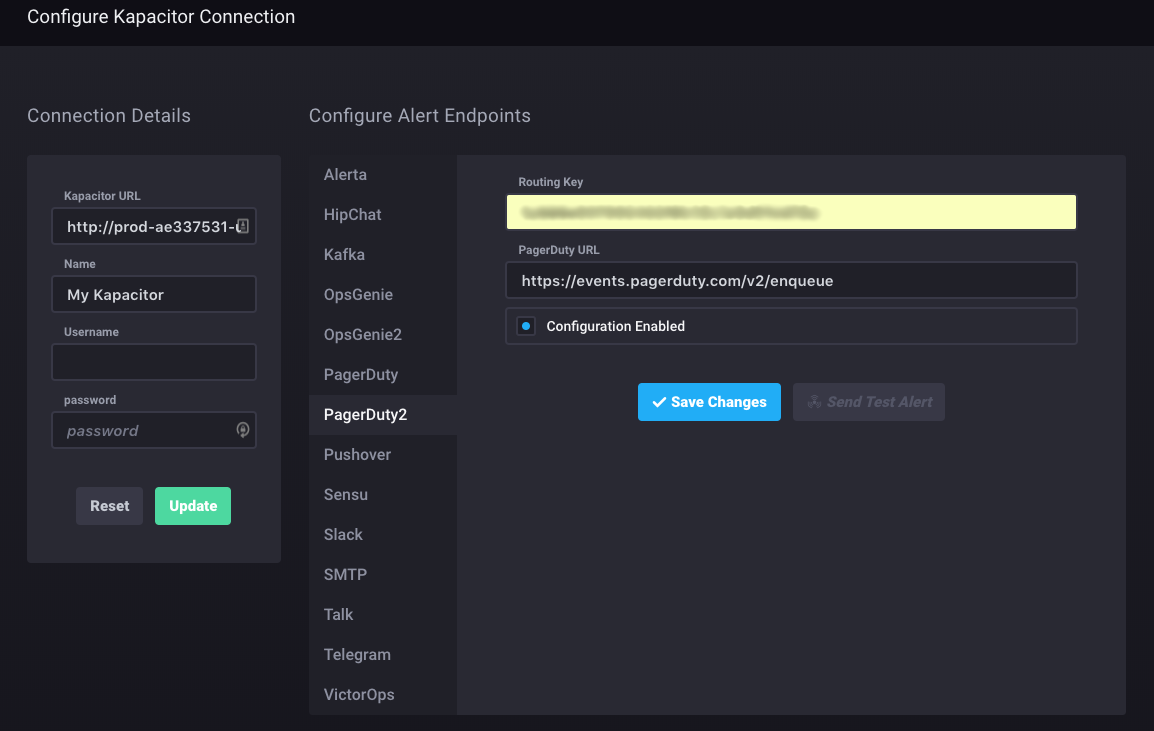
- Go to the Configure Kapacitor Connection page in the Configuration section on the InfluxDB connection you’d like the integration added to.
- Select PagerDuty2 and paste your Integration Key (from PagerDuty) in the Routing Key field.
- Ensure the PagerDuty URL field is set to https://events.pagerduty.com/v2/enqueue.
- Tick the Configuration Enabled box.
- Click Save Changes, then Send Test Alert to test the integration.
FAQ
Can I send incidents to multiple services in PagerDuty?
Yes. By utilising a TICKscript, you can direct events to other PagerDuty services depending on the routing key within the script.
Ready to get started?
Try any product on the Operations Cloud for free.
No credit card required.