- PagerDuty /
- Integrations /
- Logstash Integration Guide
Logstash Integration Guide
Logstash provides a powerful pipeline for storing, querying, and analyzing your logs. When using Elasticsearch as a backend data store and Kibana as a front-end reporting tool, Logstash acts as the workhorse. It includes an arsenal of built-in inputs, filters, codecs, and outputs, enabling you to harness some powerful functionality with a small amount of effort. This guide will go over adding PagerDuty as an output, allowing you to trigger, acknowledge and resolve incidents.
If you have any trouble setting up your integration, please contact us.
In PagerDuty
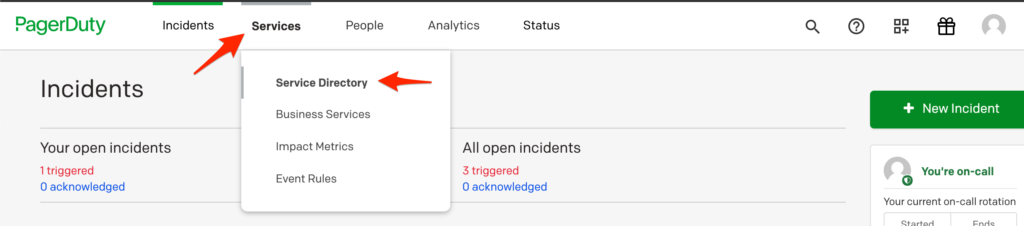
- Navigate to Services → Service Directory
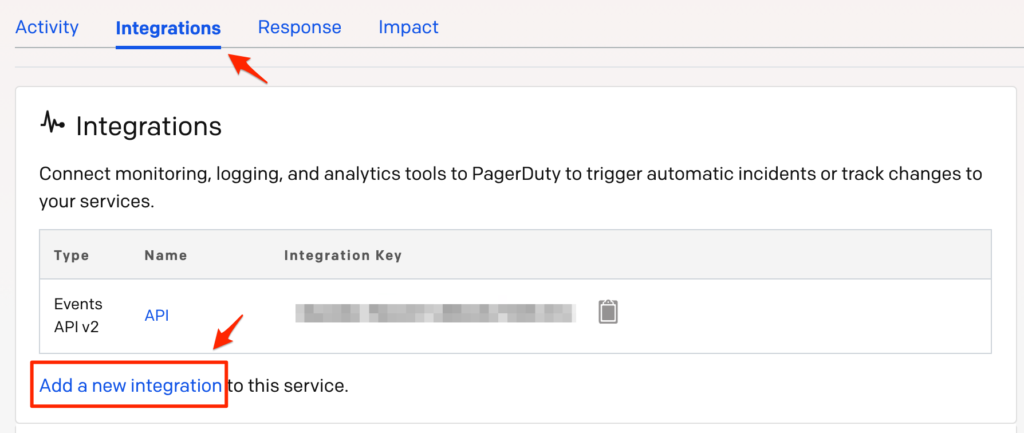
- On your Services page: If you are creating a new service for your integration, click + New Service. If you are adding your integration to an existing service, click the name of the service you want to add the integration to. Then click the Integrations tab and click the Add a new Integration link.
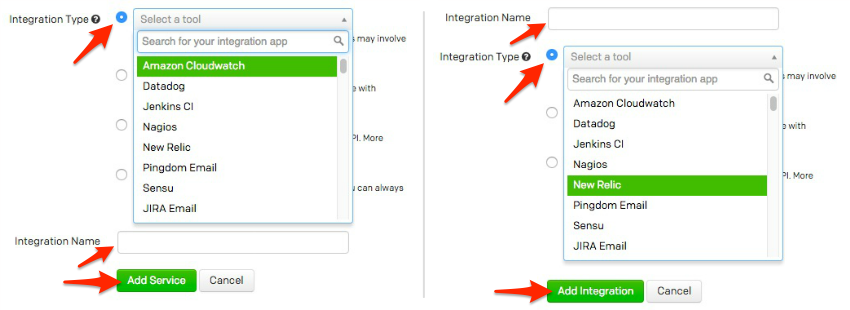
- Select your app from the Integration Type menu and enter an Integration Name.If you are creating a new service for your integration, in General Settings, enter a Name for your new service. Then, in Incident Settings, specify the Escalation Policy, Notification Urgency, and Incident Behavior for your new service.
- Click the Add Service or Add Integration button to save your new integration. You will be redirected to the Integrations page for your service.
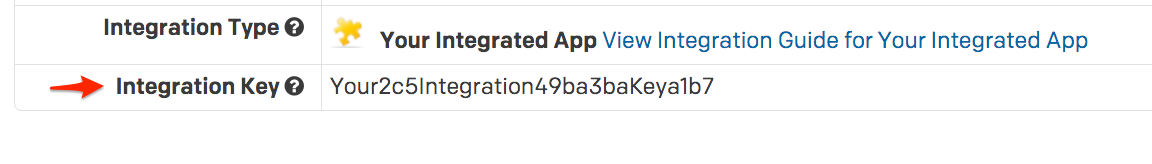
- Copy the Integration Key for your new integration:

On your server hosting Logstash
- Open or create your Logstash configuration.
- In the "output" section of your configuration, you'll want to add a pagerduty section, so that it looks similar to:
output {
  pagerduty {
    event_type => "trigger"
    description => "%{host} - %{message}"
    details => {
      timestamp => "%{@timestamp}"
      message => "%{message}"
    }
    service_key => "b2#############################c4"
    incident_key => "logstash/%{host}/%{type}"
  }
}
Please note that depending on your input source(s) and filter rules, the above variables may not be available to you.
- Be sure to replace your service_key with the Integration Key from above.
FAQ
Can I customize the criteria by which Logstash will trigger and resolve events in PagerDuty, and customize the information sent to PagerDuty?
Yes! We highly encourage you to do so, as the example given would create an incident for each log entry that is handled by Logstash, which would most likely be overwhelming.
Can I resolve an incident in PagerDuty via Logstash?
Yes. Changing the event_type => "trigger" from "trigger" to "resolve" will resolve an incident. You can also use "acknowledge" to instead acknowledge an incident. Please be aware that the incident_key will need to match the "trigger" event for a "resolve" or "acknowledge" to work.
Will incidents automatically resolve?
Your configuration will determine if/when you resolve incidents.
Can I set up Logstash to be tied to multiple PagerDuty services?
Yes, you can create multiple PagerDuty sections, each with a different Integration key.
Are incidents de-duplicated?
Yes, incidents are de-duplicated based on the value of the incident_key that you send over.
Is there a 2-way ack-back integration?
No, that isn't possible as Logstash doesn't have a concept of an incident.
Are there logs I can reference?
Yes, your Logstash installation should have a location for logs, possibly in '/var/log/' depending on your operating system that runs the Logstash service.
Is there a retry mechanism if the API call does not succeed?
Yes, the incidents are queued on disk to be retried if they aren't successfully sent.
Ready to get started?
Try any product on the Operations Cloud for free.
No credit card required.