- PagerDuty /
- Integrations /
- Prometheus Integration Guide
Prometheus Integration Guide
Prometheus + PagerDuty Benefits
- Send richly formatted event data from Prometheus to PagerDuty, allowing you to engage the right people, accelerate resolution and improve learning.
- Create high and low urgency incidents based on the severity of the event from the Prometheus event payload.
How it Works
- Prometheus sends events to PagerDuty via a Prometheus Alertmanager configuration file. Events from Prometheus will trigger a new incident on the corresponding PagerDuty service, or group as alerts into an existing incident.
- You can resolve PagerDuty incidents from the Prometheus server as long as the
send_resolvedconfiguration option is not set tofalse. The default value istrue, so there’s no need to specifysend_resolved: trueto have PagerDuty incidents be resolved automatically.
Requirements
- Important note for Prometheus Alertmanager v0.11 and later: Alertmanager now supports Events API v2. However, if you set the
routing_keyproperty and use v2, the integration type of the integration corresponding to therouting_keyvalue must also be Events API v2. If you select Prometheus as the integration type in PagerDuty, you will need to use the Events API v1 type and set a value for theservice_keyproperty instead. - A Manager base role or higher is required to configure this integration. If you're not sure what role you have, or if you need your permissions adjusted, visit our sections on Checking Your User Role or Changing User Roles.
Integration Walkthrough
In PagerDuty
There are two ways to integrate with PagerDuty: via Event Orchestration or directly through an integration on a PagerDuty service. Integrating with Event Orchestration may be beneficial if you want to build different routing rules based on the events coming from the integrated tool. Integrating with a PagerDuty service directly can be beneficial if you don’t need to route alerts from the integrated tool to different responders based on the event payload.
Integrating with Event Orchestration
- In the PagerDuty web app, hover over the Automation menu, select Event Orchestration, and select your desired orchestration or create a new one.
- Click Global Orchestration Key, copy your Integration Key, and keep it in a safe place for later use.
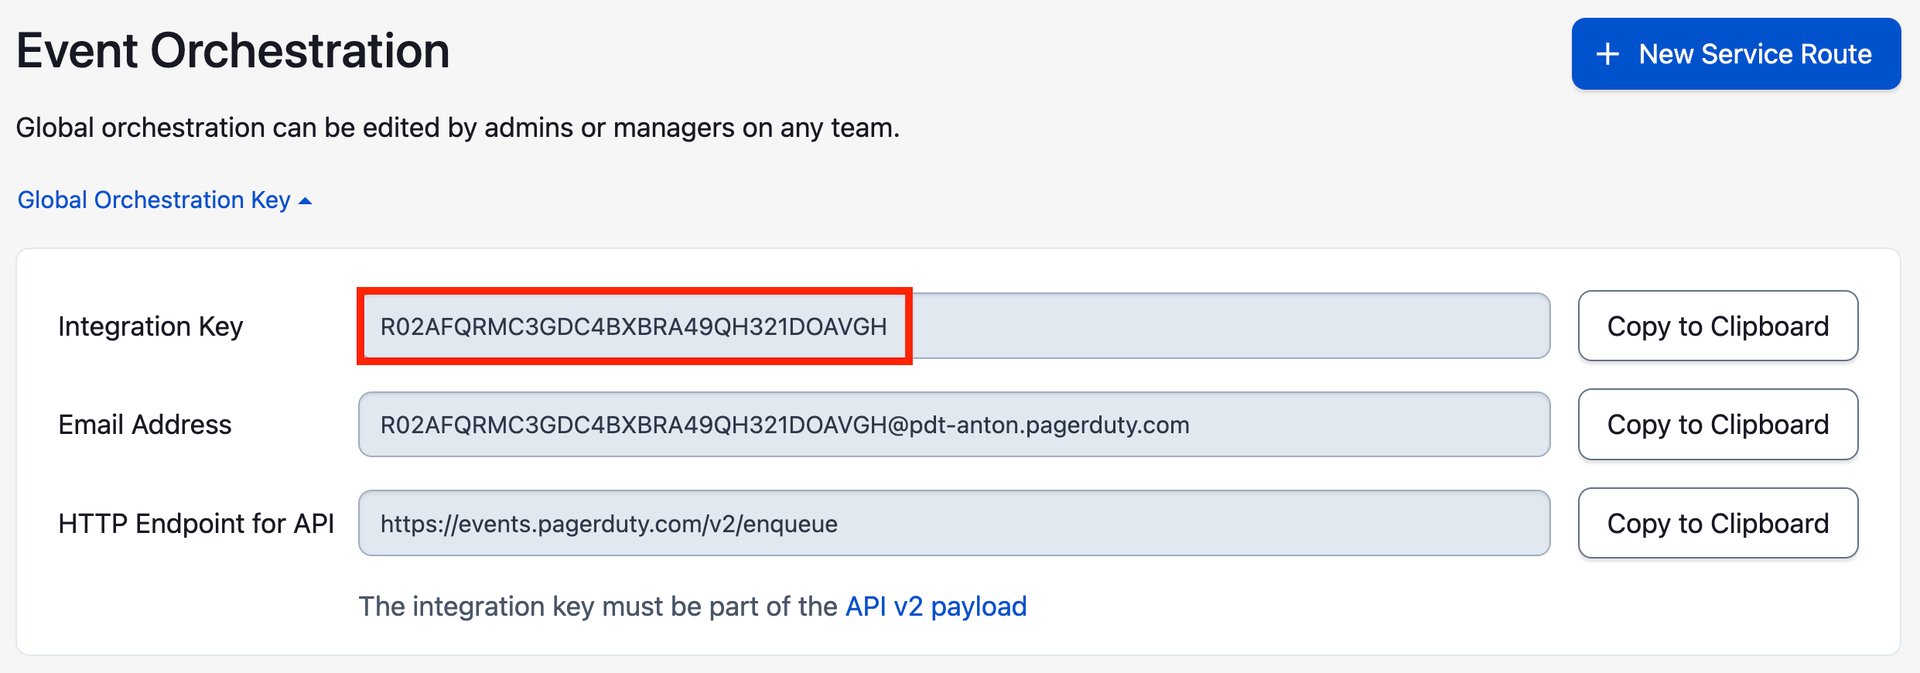
- You can now proceed to the On Your Prometheus Server section below.
Integrating With a PagerDuty Service
- From the Services menu, select Service Directory.
- If you are adding your integration to an existing service, click the name of the service you want to add the integration to. Then select the Integrations tab and click the Add a new integration.
If you are creating a new service for your integration, please read our documentation in section Configuring Services and Integrations and follow the steps outlined in the Create a New Service section. - Select Events API v2 OR Prometheus (which uses Events API v1), depending on your preference, from the Integration Type menu (see the Requirements section above for more details on these options).
- Click Add Service or Add Integration to save your new integration. You will be redirected to the Integrations tab for your service.
- Find your integration in the list and click ∨ to the right. Copy the Integration Key and keep it in a safe place for later use.
On Your Prometheus Server
- Install the Prometheus Alertmanager if you don’t have it installed already. The Alertmanager is required for this integration, as it handles routing alerts from Prometheus to PagerDuty.
- Create an Alertmanager configuration file if you don’t have one already. You can find an example configuration file on GitHub.
- Create a
receiverfor PagerDuty in your configuration file. Give the receiver aname, such as "PagerDuty-Event-Orchestration" or the name of the Service you’re integrating with. Next, paste the PagerDuty Integration Key (generated in the In PagerDuty section, above) in theservice_keyfield, then save your configuration file.
receivers: - name: YOUR-RECEIVER-NAME pagerduty_configs: - service_key: YOUR-INTEGRATION-KEY - You can configure the default
routein Prometheus to send all alerts which don’t match any custom routes to your new PagerDutyreceiver. Here’s an example showing how you would configure the defaultroute:route: group_by: [cluster] receiver: YOUR-RECEIVER-NAME - You can also configure custom `routes` to send alerts to different `receivers`. For example, if you only want alerts with the severity of `warning` to be sent to PagerDuty, you would set a different default route and create a special `warning` route like this:
routes: - match: severity: 'warning' receiver: YOUR-RECEIVER-NAME -
Thanks to the Prometheus Alertmanager’s powerful
routesandreceiverconfiguration options, you can configure multiplereceivers with different PagerDuty integration keys, and differentroutesto send specific types of alerts to differentreceivers.Here’s an example configuration which sets up a
routethat captures alerts for a database service and sends them to areceiverlinked to a service that will directly notify the DBAs I have in PagerDuty, while all other alerts will be directed to a defaultreceiverwith a different PagerDuty integration key:route: group_by: [cluster] receiver: **DEFAULT-RECEIVER** group_interval: 5m routes: - match: service: database receiver: **DATABASE-RECEIVER** receivers: - name: **DEFAULT-RECEIVER** pagerduty_configs: - service_key: **PRIMARY-INTEGRATION-KEY** - name: **DATABASE-RECEIVER** pagerduty_configs: - service_key: **DATABASE-INTEGRATION-KEY** - Start the Alertmanager, or restart it for your configuration changes to take effect if it was already running.
- Congratulations! Prometheus will now be able to trigger and resolve incidents in PagerDuty. You can verify this by triggering a test incident using the following
curlcommand:
curl -d '[{"labels": {"Alertname": "PagerDuty Test"}}]' https://localhost:9093/api/v1/alertsFAQ
Will PagerDuty incidents be resolved when an alert is resolved in Prometheus?
Yes, as long as the send_resolved configuration option is not set to false. The default value is true, so there’s no need to specify send_resolved: true to have PagerDuty incidents be resolved automatically.
Also note that resolve notifications may take up to the next group_interval to be sent, and only a “best effort” is made to send the notification to PagerDuty according to the Prometheus Team.
I only get one notification for multiple different Prometheus alerts; how do I fix this?
Try adjusting the match and group_by options for your PagerDuty route. The deduplication key (a.k.a. incident key), which is used to determine whether alerting events concern a unique issue, is generated based on these options. If a series of alerts have the same values for the properties in group_by, they will have the same value for the deduplication key and thus will be merged into the earliest existing open alert/incident (rather than triggering new ones).
Ready to get started?
Try any product on the Operations Cloud for free.
No credit card required.