- PagerDuty /
- Integrations /
- Splunk Security Integration Guide
Splunk Security Integration Guide
Splunk collects and indexes data from just about any source imaginable – network traffic, Web servers, custom applications, application servers, hypervisors, GPS systems, stock market feeds, social media, and preexisting structured databases.
In PagerDuty
- From the Services menu, select Service Directory.
- On your Services page:
If you are creating a new service for your integration, click +New Service.If you are adding your integration to an existing service, click the name of the service you want to add the integration to. Then click the Integrations tab and click Add a new integration. - Select your app from the Integration Type menu and enter Splunk as the integration name.
If you are creating a new service for your integration, in General Settings, enter a Name for your new service. Then, in Incident Settings, specify the Escalation Policy, Notification Urgency, and Incident Behavior for your new service. - Click the Add Service or Add Integration button to save your new integration. You will be redirected to the Integrations page for your service.
- Copy the Integration URL for your new integration.
In Splunk
- First you'll need to install the PagerDuty App for Splunk from the Splunk App store. Click the Apps button at the top left -> Find More Apps
- Search for the PagerDuty App for Splunk and then click Install.
- Once the app has been installed, head to the Settings menu and choose Alert actions.
- Make sure that the PagerDuty app is Enabled and then click Setup PagerDuty Incidents to the right.
- Paste the Integration URL for your PagerDuty service into the supplied field.
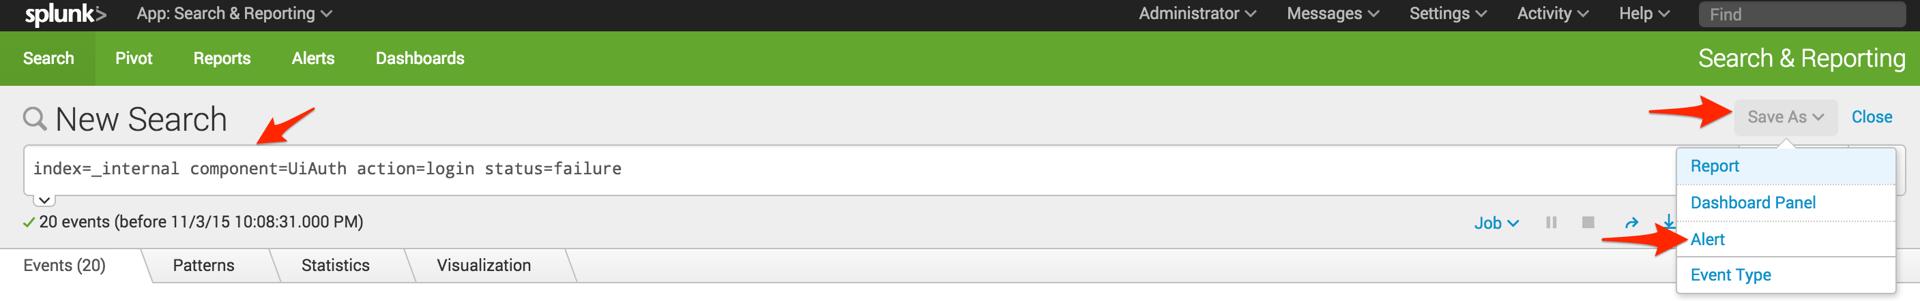
- Run the search in Splunk for which you'd like to create an alert.
- Click Save As and select Alert.
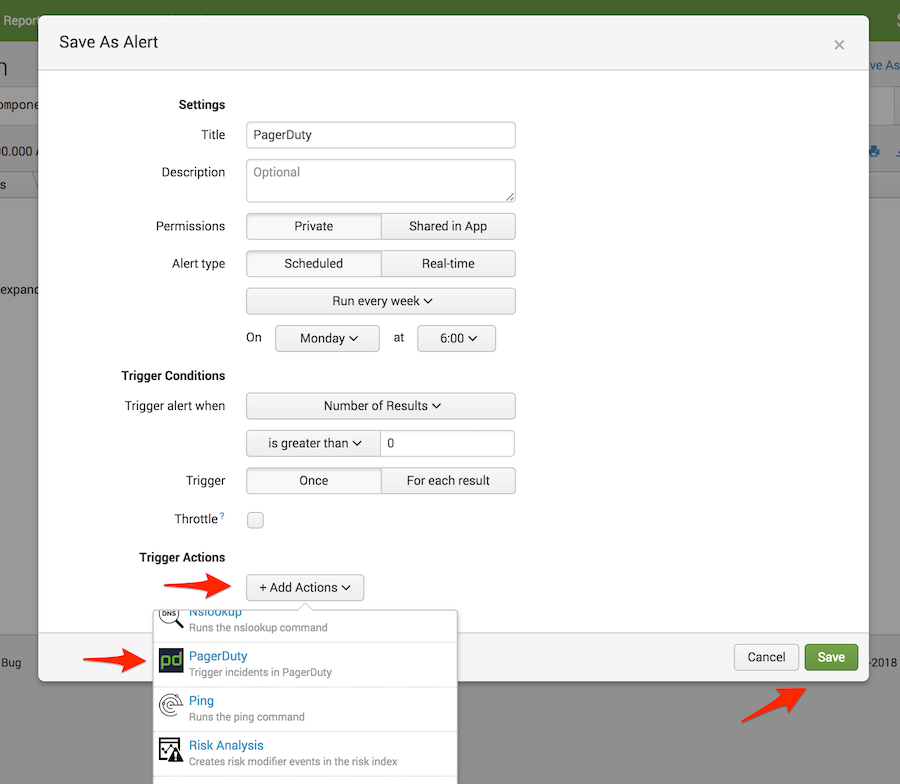
- Add a Title for the new alert, specify the conditions under which you'd like it to trigger an alert and add a new Trigger Action. Select PagerDuty as the trigger action type. By default, this will notify the integration URL you established when you set up the PagerDuty app.
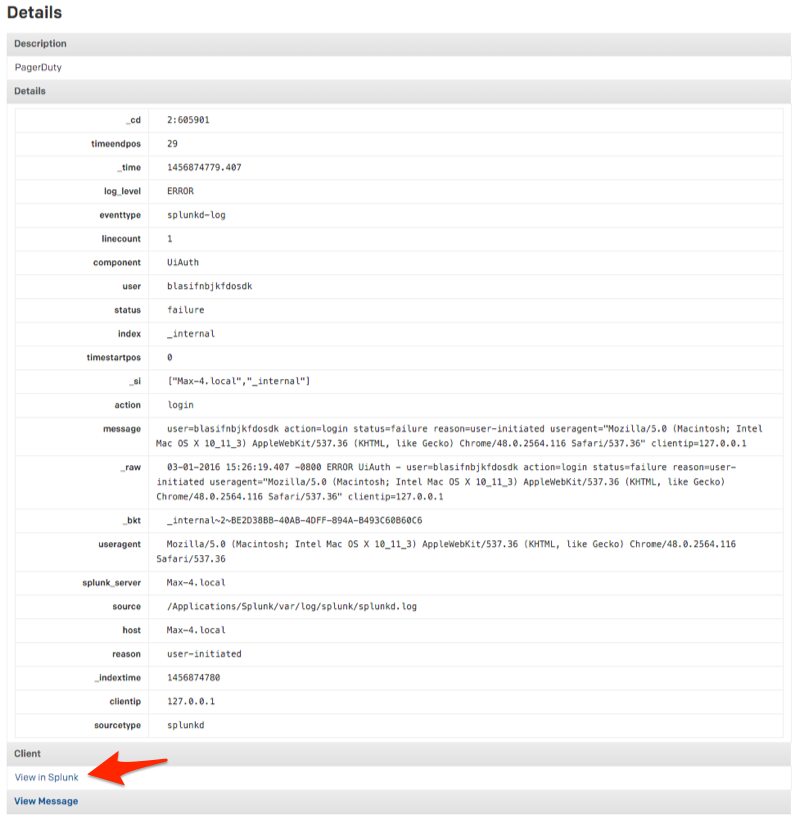
View incident in Splunk
Clicking to the incident details will provide a breakdown of the alert and will provide you with a link to view the search in Splunk by clicking the View in Splunk button.
Frequently Asked Questions
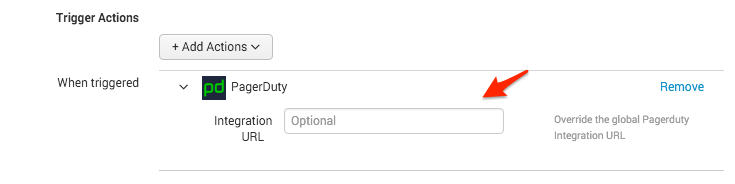
Can Splunk send alerts to more than one PagerDuty service?
Yes. If you are interested in notifying a different Splunk service in PagerDuty, you can paste that service's integration URL in the optional Integration URL field under Trigger Actions when creating a new alert. This will override the global PagerDuty Integration URL established when you set up the PagerDuty Incidents app.
Will PagerDuty incidents resolve once the Splunk search is no longer producing results?
No. At this time, the PagerDuty incident must be resolved from PagerDuty.
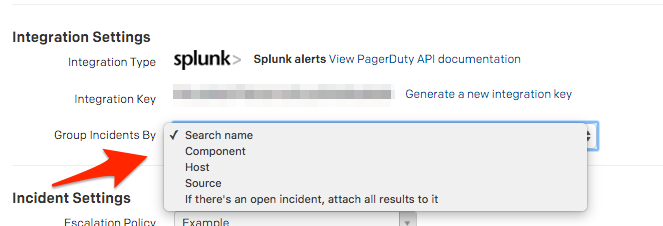
How does PagerDuty group incoming alerts from Splunk?
If you select Edit Service from the main service view, you'll be able to choose to group incidents by search name, component, host, source or to attach all incoming alerts to an open incident.
Ready to get started?
Try any product on the Operations Cloud for free.
No credit card required.