Zabbix is a very powerful open source enterprise-class network management system designed to monitor the status of network services, servers and other hardware. It’s playing an important role in monitoring IT infrastructure for many organizations.
PagerDuty extends Zabbix’s functionality by providing on-call scheduling, alerts and incidents tracking through the PagerDuty API. PagerDuty notifies you of the most critical Zabbix events so that you are able to take immediate action.
This guide describes how to integrate your Zabbix 3.x installation with PagerDuty using a Python script. This guide will provide instructions on setting up a script, a media type, a user and an action in Zabbix. You might need to slightly alter these instructions depending on your exact Linux distribution. Please Note: Zabbix 3.x is largely the same as 4.x, the biggest difference is the term “macro” is used in 4.x instead of “actions”.
In PagerDuty
- From the Services menu, select Service Directory.
-
- If you are creating a new service for your integration, click + New Service.
- If you are adding your integration to an existing service, click the name of the service you want to add the integration to. then click the Integrations tab and click Add a new integration.
- Select your integration from the Integration Type menu and enter an Integration Name. If you are creating a new service for your integration, in General Settings, enter a Name for your new service. Then, in Incident Settings, specify the Escalation Policy, Notification Urgency, and Incident Behavior for your new service.
- Click the Add Service or Add Integration button to save your new integration. You will be redirected to the Integrations page for your service.
- Copy the Integration Key for your new integration.
In Zabbix
The configuration consists of a media type in Zabbix, which will invoke the pd-zabbix integration script to send alerts to PagerDuty through the PagerDuty Agent. To utilize the media type, we will create a Zabbix user to represent PagerDuty. We will then create an alert action to notify the user via this media type whenever there is a problem detected.
Install PagerDuty Agent and the integration scripts
- Install the PagerDuty Agent as described in the Agent Install Guide.
- Make a symlink to the
pd-zabbix script in Zabbix’s AlertScriptsPath directory. This is usually /etc/zabbix/alert.d or /usr/local/share/zabbix/alertscripts but it can be changed. Check your zabbix_server.conf file to see how this option is configured, and in the following command, replace /etc/zabbix/alert.d/ with the alert scripts path configured for your Zabbix server:sudo ln -s /usr/share/pdagent-integrations/bin/pd-zabbix /etc/zabbix/alert.d/
Create the PagerDuty media type
- Go to the Administration tab.
- Under Administration, go to the Media types page and click the Create Media Type button.
- On the following Media Type configuration page, enter “PagerDuty” for Description, and set
pd-zabbix as the Script name.
- Click the Add link in the Script parameters box three times to create three configurable parameters for the script, and enter the following template values for the three parameters in exactly the following order:
{ALERT.SENDTO}{ALERT.SUBJECT}{ALERT.MESSAGE}
- Click the Add button at the bottom to save and create the PagerDuty media type.
Create the PagerDuty user and user group for alerting
- Go to the Administration tab.
- Under Administration, go to the Users Groups page and click the Create user group button.
- Enter a name in the Group name field that identifies it as part of the integration, such as, “PagerDuty Service”.
- Next, you will grant read permissions on Host Groups to the user group, in order to choose which hosts will produce PagerDuty notifications when they have alerts. Select the Permissions tab, select the Read permission level and click the Select button.
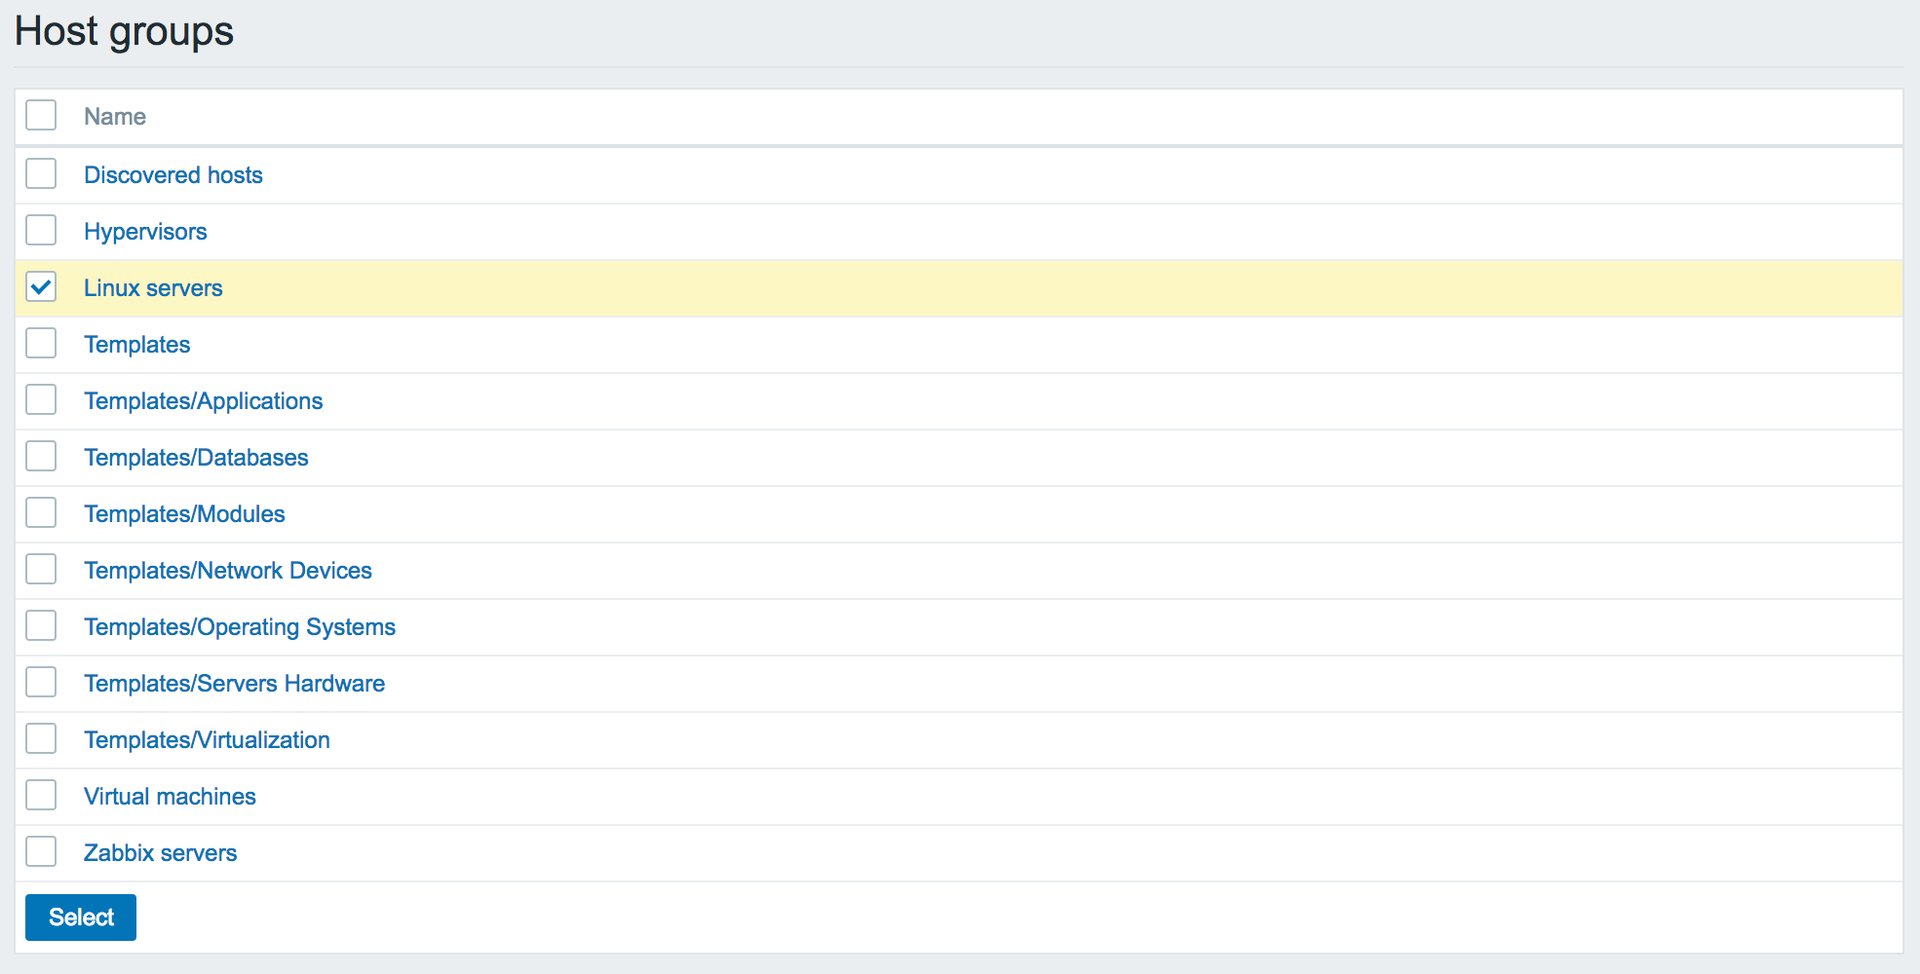
- Select which Host Groups you would like the PagerDuty to have read access to for monitoring, then click the Select button. In this example, we grant the PagerDuty group read access to the Linux servers group.
- Click Add to save your new user group.
- Click the Users tab (under Administration) and click the Create User button.
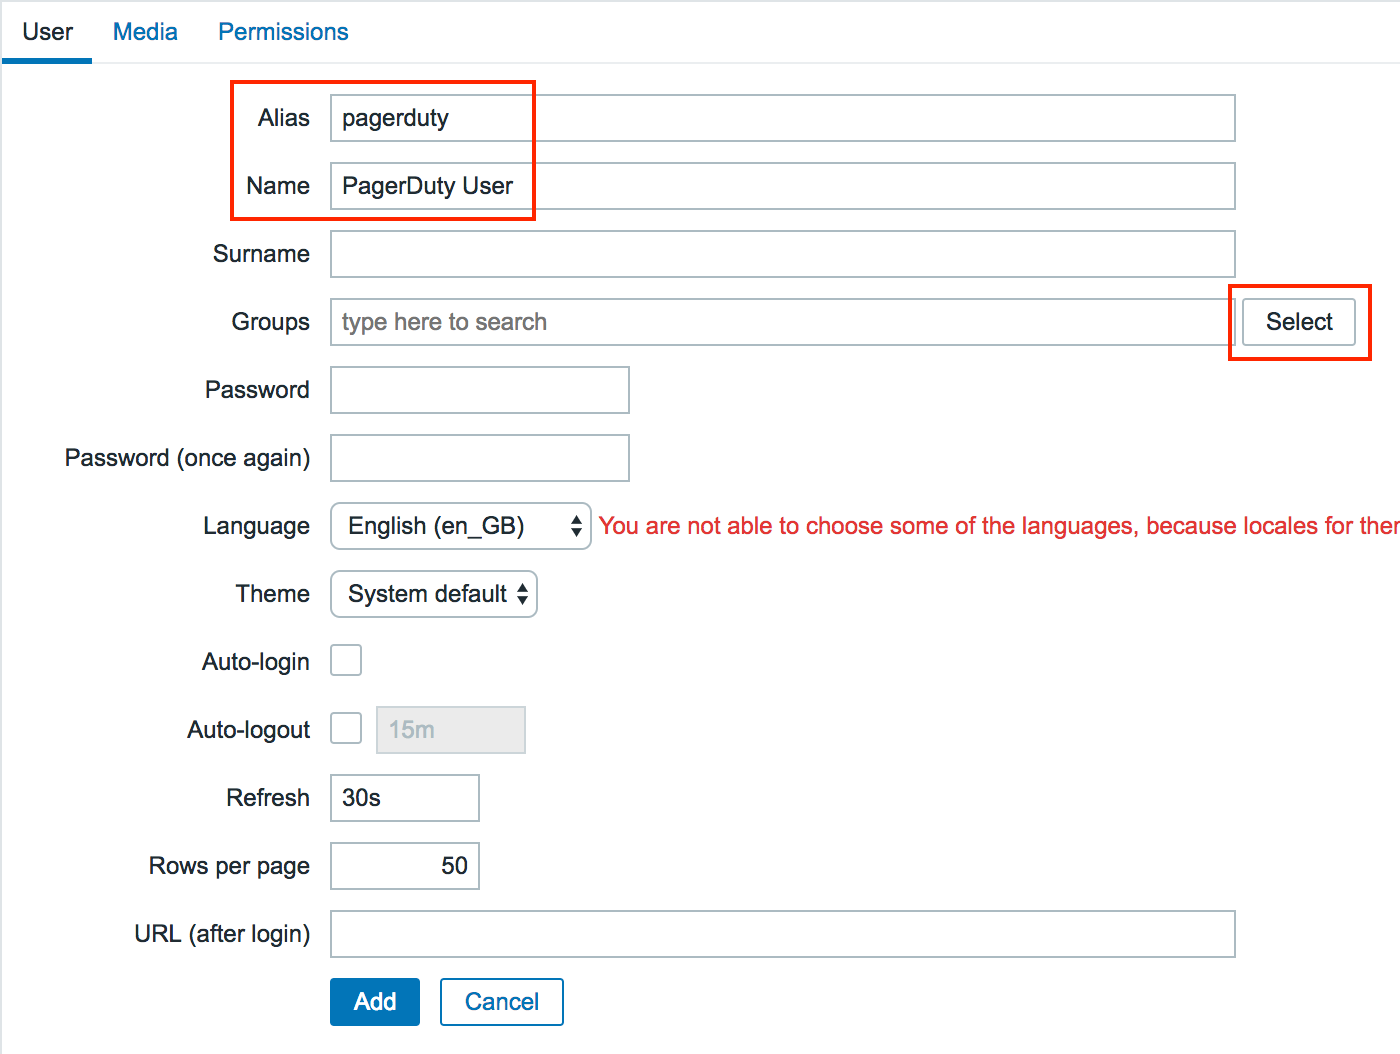
- Fill in the details of this new user, and name it “PagerDuty User”. The default settings for PagerDuty User should suffice as this user will not be logging into Zabbix.
- Click the Select button next to Groups.
- In the new window that appears, check the box next to the PagerDuty Service user group we just created, and click Select.
- Click on the Media tab and, inside of the Media box, click the Add button.

- In the new window that appears, configure the media for the user:
- For the Type, select PagerDuty (the new media type that was created).
- For Send to: Enter the Integration Key from PagerDuty.
- Make sure the Enabled box is checked.
- Click the Add button when done.
- Click the Add button at the bottom of the user page to save the user.
Create the alert action
- Go to the Configuration tab.
- Under Configuration, go to the Actions page, and click on Create Action.
- Give the action a Name such as “PagerDuty Notifications” and click Add.
- Go to the Operations tab, and configure as follows:
- Set the Default subject to
trigger, verbatim. Nothing else should be part of the subject line.
- Delete the contents of the Default message field, and insert the following:
name:{TRIGGER.NAME}
id:{TRIGGER.ID}
status:{TRIGGER.STATUS}
hostname:{HOST.NAME}
ip:{HOST.IP}
value:{TRIGGER.VALUE}
event_id:{EVENT.ID}
severity:{TRIGGER.SEVERITY}
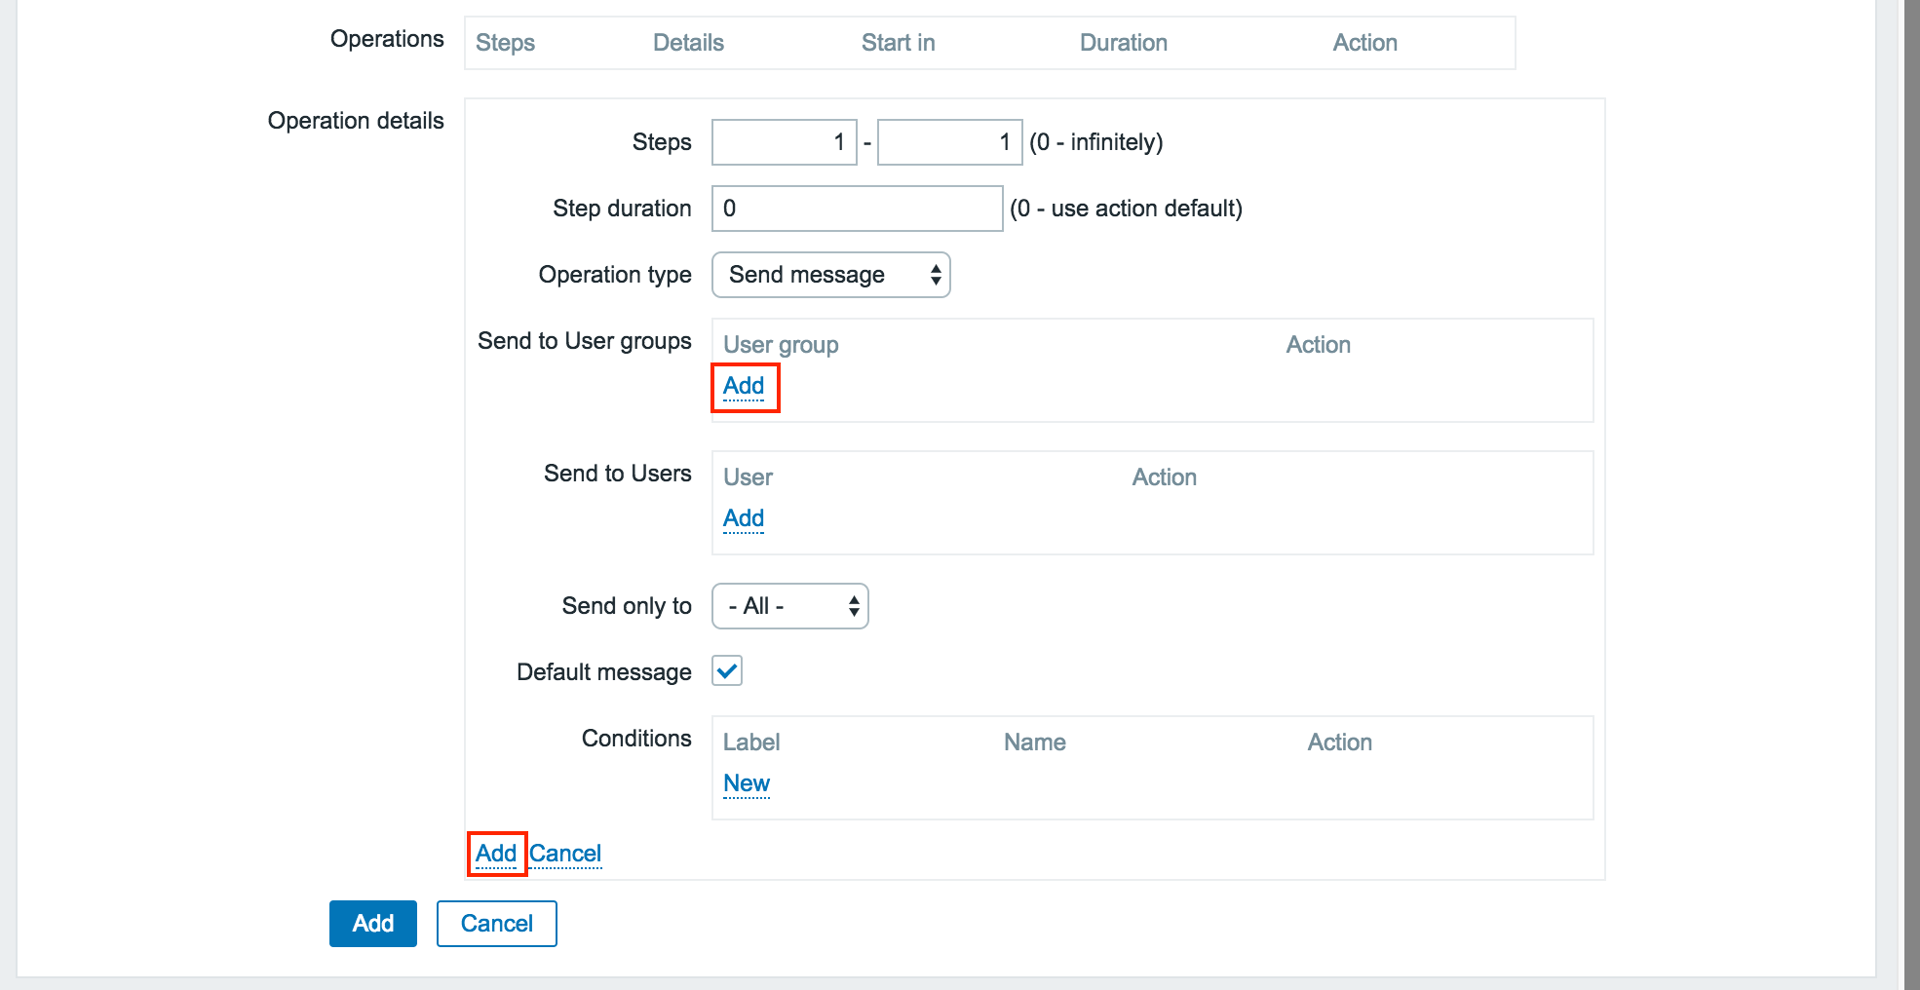
- Under Operations, click New, and in the resulting operation details configuration, under Send to User groups, click Add. In the pop-up window, check the box by the PagerDuty Service user group, click Select, and then click Add at the bottom of the Operations section.
- Go to the Recovery Operations tab, set the Default subject to
resolve, verbatim, and configure the rest of the options in the same way as in steps 2-3 in the Operations configuration (see above). For instance, the content of the Recovery message should be the same as the Default message. 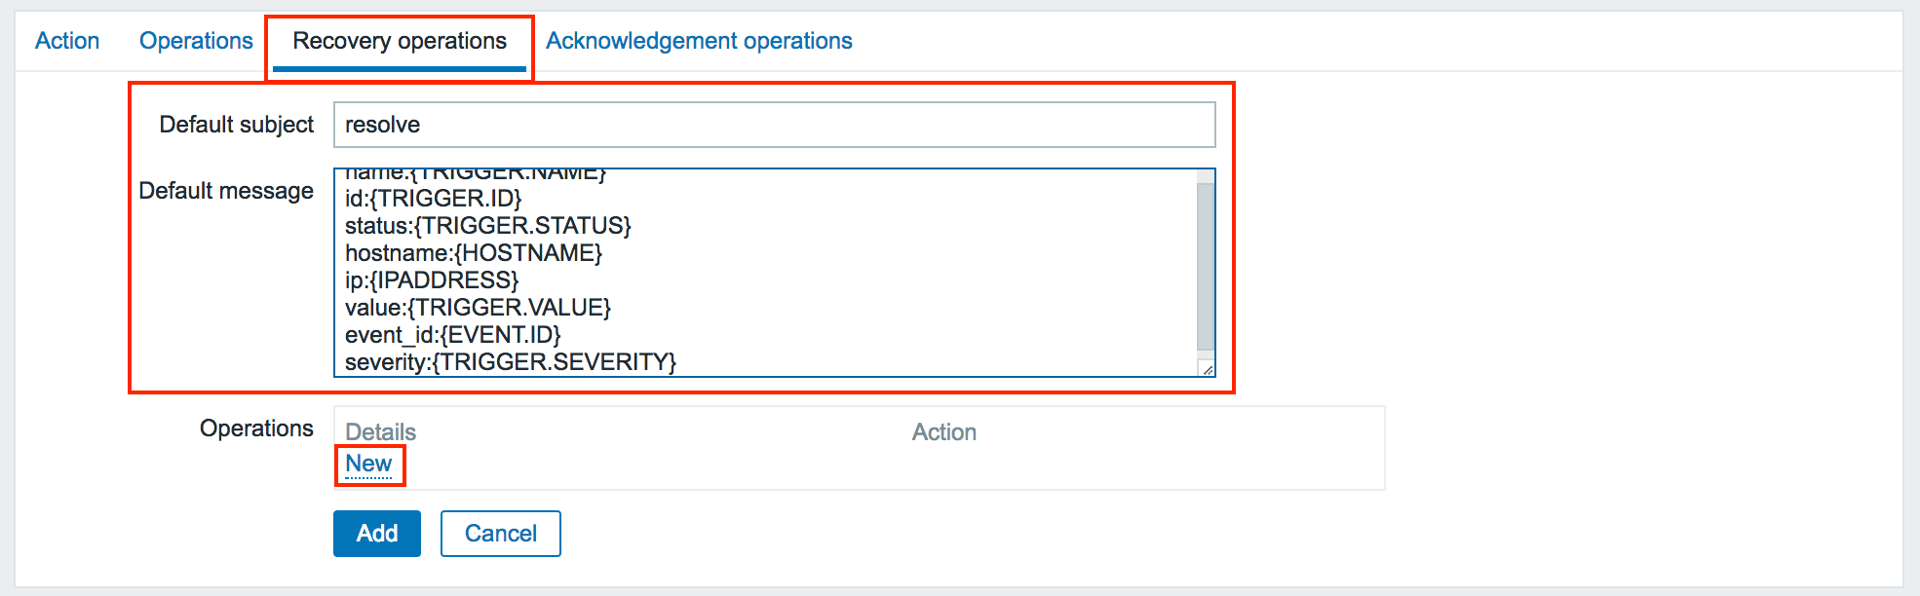
- Go to the Acknowledgment Operations tab, set the Default subject to
acknowledge, verbatim, and configure the rest of the options in the same way as with the Operations and Recovery operations, above. 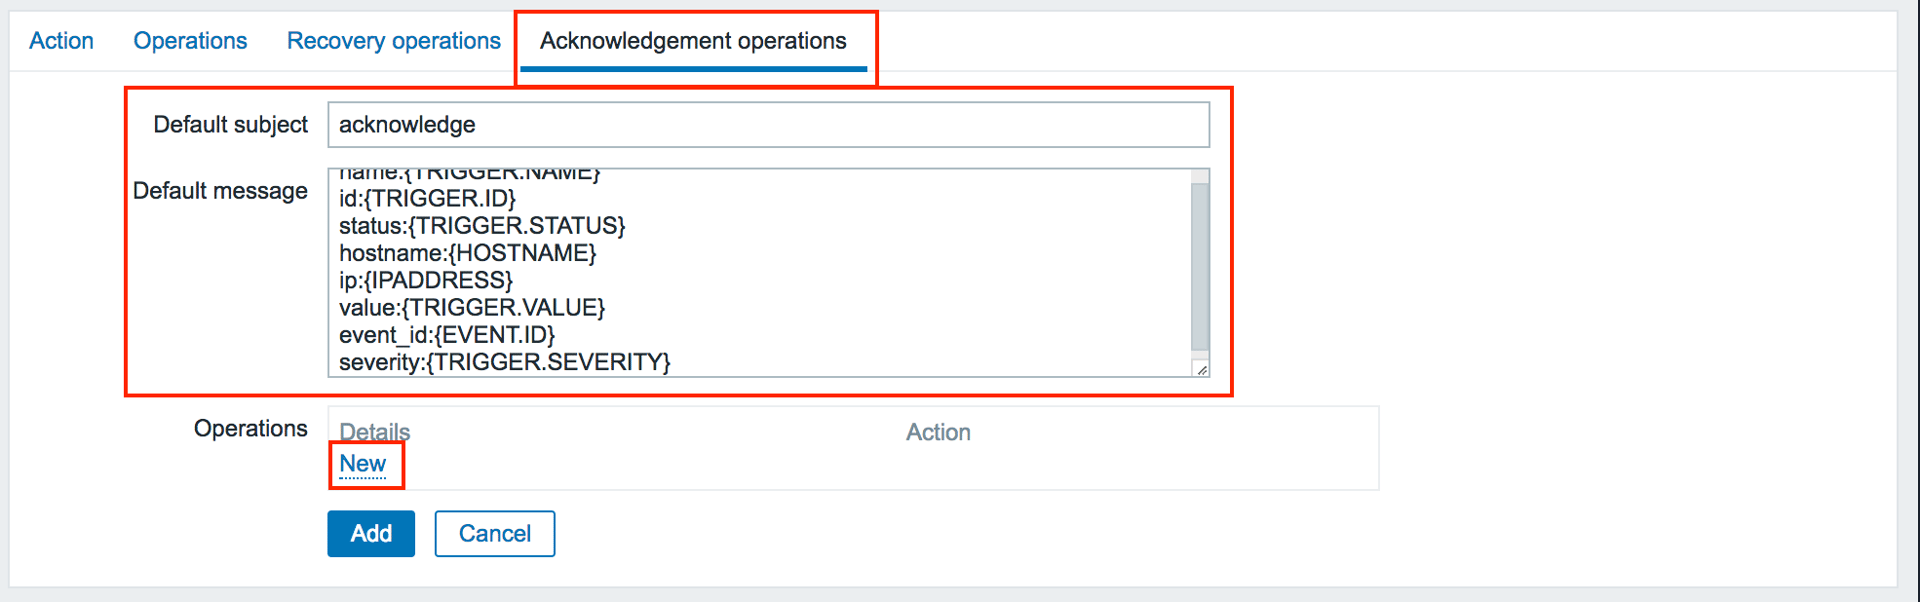
- Click the Add button at the bottom of any of the action tabs to save your action.
Congratulations! Your Zabbix should now be integrated with PagerDuty!
FAQ
What if a Zabbix event happens while my network is down?
You should also configure an external ping check service to monitor your site’s external connectivity. Of course, you can use PagerDuty to forward alerts from these services as well.
How do I setup Zabbix to work with multiple PagerDuty services?
This is easy to do with the current integration, all you would need to do is setup multiple actions with separate action conditions and action operations. You would also need to setup a separate user group, user and media. The additional media would use the service key of your additional service and would be of type PagerDuty.
The integration doesn’t seem to be working. What’s going on?
First, make sure you’ve installed the PagerDuty Agent, and that there were no errors from your package manager when attempting to install it. Failed installs (i.e. due to an incompatible distribution, such as CentOS 5) are the most common issue with the integration not working.
More troubleshooting tips can be found in our Zabbix Troubleshooting Guide.