- PagerDuty /
- Integrations /
- Watcher Integration Guide
Watcher Integration Guide
Watcher is the alerting and notification product for Elasticsearch that lets you take action based on changes in your data. It is designed around the principle that if you can query something in Elasticsearch, you can alert on it. Simply define a query, condition, schedule, and the actions to take, and Watcher will do the rest.
In PagerDuty
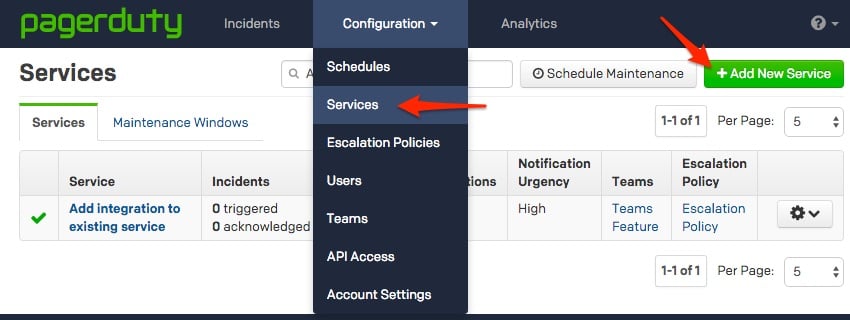
- Go to the Services menu and select Service Directory.
- In the Service Directory page:
- If you are creating a new service for your integration, click New Service.
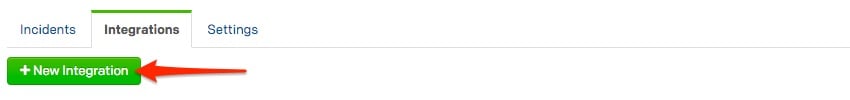
- If you are adding your integration to an existing service, click the name of the service you want to add the integration to. Then click the Integrations tab and click the New Integration button.
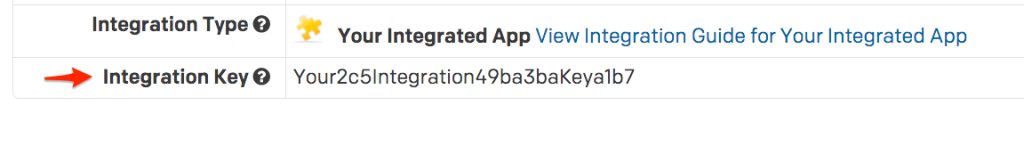
- In the Integration Type section, choose one of the following options based on your preference:
- Select Use our API directly and select Events API v2 if you would like to be able to set severity for incidents generated by the Watcher integration.
- Select a Tool and select Watcher from the dropdown. This integration type has limited incident actions available
If you are creating a new service for your integration, in General Settings, enter a Name for your new service. Then, in Incident Settings, specify the Escalation Policy, Notification Urgency, and Incident Behavior for your new service.
- Click the Add Service or Add Integration button to save your new integration. You will be redirected to the Integrations page for your service.
- Copy the Integration Key for your new integration.
On Your Elastic Watcher Server
- Verify that Watcher is set up and running on your server.
The watcher state in the response should read started:
curl -XGET 'https://localhost:9200/_watcher/stats?pretty'- Configure a watch with a Webhook action for PagerDuty and use a PUT request to add it to your watcher.
Note: The watch below is set to always execute every 10 seconds for testing purposes. In most production environments you will want to update the trigger and condition to only execute the action when there is an issue to reduce noise. You may also want to add a throttle period to your PagerDuty action to prevent duplicate triggers in PagerDuty. You can find detailed instructions on configuring each aspect of your watches in the Elastic Watcher Documentation.
Make sure to update the service_key in the body of the action with the integration key you copied in step 5 above:
curl -XPUT 'https://localhost:9200/_watcher/watch/cluster_health_watch' -d '{
  "trigger" : {
    "schedule" : { "interval" : "10s" }
  },
  "input" : {
    "http" : {
      "request" : {
       "host" : "localhost",
       "port" : 9200,
       "path" : "/_cluster/health"
      }
    }
  },
  "condition" : {
    "always" : {}
  },
  "actions" : {
    "pagerduty": {
      "webhook": {
        "scheme": "https",
        "method": "POST",
        "host": "events.pagerduty.com",
        "port": 443,
        "path": "/generic/2010-04-15/create_event.json",
        "body": "{\"service_key\": \"ENTER_YOUR_SERVICE_KEY_HERE\",\"event_type\": \"trigger\",\"description\": \"Issue in elastic watcher\"}",
        "headers": {"Content-type": "application/json"}
      }
    }
  }
}'- At this point, the integration should be configured and you are all set. As soon as there is an issue that meets your watch's condition, the incident will trigger within PagerDuty
FAQ
Can I acknowledge and resolve incidents in PagerDuty from Elastic Watcher?
Yes, when defining your action for any of your watches you can specify the event_type in the body of your request. This attribute must be one of trigger, acknowledge, or resolve.
Can I attach my watcher to multiple PagerDuty services?
Yes, this is easy to accomplish with the current integration. All you would need to do is define multiple watches or multiple actions within your watch that contain the different integration keys.
How can I confirm that my watch is performing the proper action?
You can check the watch history or status_index to see what actions have been performed when your watch conditions are met:
curl -XGET 'https://localhost:9200/.watch_history*/_search?pretty' -d '{
  "query" : {
  "match" : { "result.condition.met" : true }
}
}'
If this request does not produce any results, your watch has not yet had its condition met and no actions would have been triggered.
My watch is having its condition met but my action is not triggering an incident in PagerDuty
In this scenario there is an issue with the parameters you defined for the PagerDuty action. Some of the most common issues we encounter are:
- Using the HTTP scheme instead of HTTPS. Note: if the scheme is missing from your watch, it will default to HTTP.
- Using a port other than 443.
- Failing to provide a description within the body of the action.
Ready to get started?
Try any product on the Operations Cloud for free.
No credit card required.