The management of modern digital systems is complex and always-on.
As customers require more reliable systems, demands on technical teams increase, including after-hours and overnight response to issues. In this edition of The State of Digital Operations, we are looking at the impact this new work style has on teams.
Many organizations have seen unprecedented levels of change over the last two years. Additionally, the changes in the labor markets, particularly in the United States - the “Great Resignation” - led us to investigate the impact of inconsistent working hours on attrition.
We wanted to know if technical employees are more likely to leave certain kinds of teams based on after-hours expectations.
Finally, picking up another pandemic-related narrative, we dug deeper into the impact of incidents for various industries, looking at teams in the Travel and Hospitality industry. As a part of the economy first devastated by lockdowns and travel restrictions, and then alternatively met with increased and decreased demand due to various pandemic waves, we wanted to see what the data could tell us about the health of technical teams in travel-related companies.
About the survey
These findings are powered by results from a recent customer survey and backed by data collected from the PagerDuty platform, consisting of over 1 million users across 30,000+ companies.
Data Source
The total sample size was 5,849 users. Potential participants were collected by determining the customers who could be classified as a PagerDuty Power User (frequent users).
Groups
Potential participants were split into two groups, one group was offered an incentive for completing the survey and one group was offered no incentive as a control.
Results
A total of 293 customers participated in the survey resulting in a response rate of 5% which falls within the industry average response rate of 5% - 30%. The incentivized group had a response rate of 6.9% which significantly outperformed the non incentivized group which had a response rate of 3.1%.
Summary of key findings
1.
Investments in DevOps can power teams to accelerate their operational maturity growth.
2.
Work hours becomes more consistent when teams are more operationally mature.
3.
Attrition and burnout rates improve when work becomes more consistent.
4.
Operational maturity and investment in modern practices also leads to better response time and more even distribution of work across teammates.
1. Operational maturity
Operational maturity plays a [key] role in how well teams are able to handle incident response and unplanned work. We looked at several data points across customer accounts to correlate behaviors and outcomes with operational readiness and advanced configurations that support automation.
Manual
No inbound integrations
Reactive
Has some inbound integrations but not other configurations
Responsive
Has schedules and multiple escalation levels
Proactive
Uses outbound integrations, service dependencies, change events, or response plays
Preventative
Adopts EI features or consumes analytics
We found that improving operational maturity positively correlated to higher workday consistency, a more even distribution of work among team members, and more efficient response to incidents. There is still opportunity for improvement in many organizations. Among our survey respondents, nearly 50% classified their teams as "Responsive", while only 8% described their teams as "Proactive". Fortunately, only 14% classified their teams as "Manual" or "Reactive"!
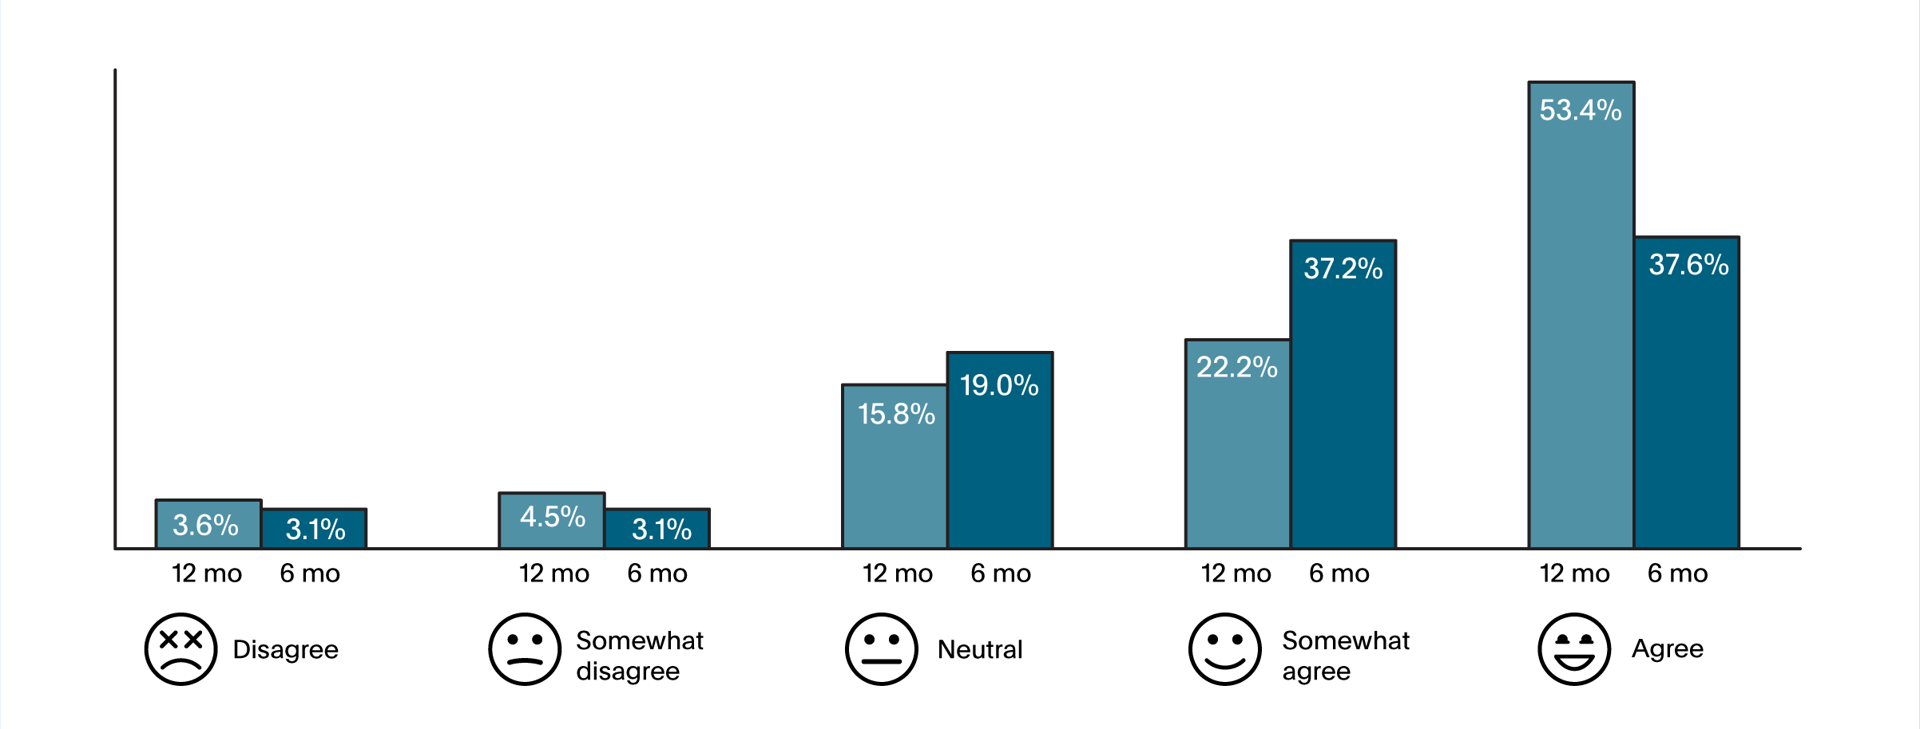
Additionally, our survey respondents feel like their teams are improving. While teams aren't all in the Preventative category, when we asked responders if their teams were better at resolving critical incidents today than they were 6 and 12 months ago, the majority agreed or strongly agreed.
14%
classified their teams as Manual or Reactive
50%
classified their teams as Responsive
8%
classified their teams as Proactive
Are your teams better at resolving critical incidents than they were 12 and 6 months ago?
2. Working hour consistency
"We’re on-call every third week for 24 hours per day. We can put in at minimum 15 hours per week up to 30 hours extra on top of our normal work week."
Survey respondent
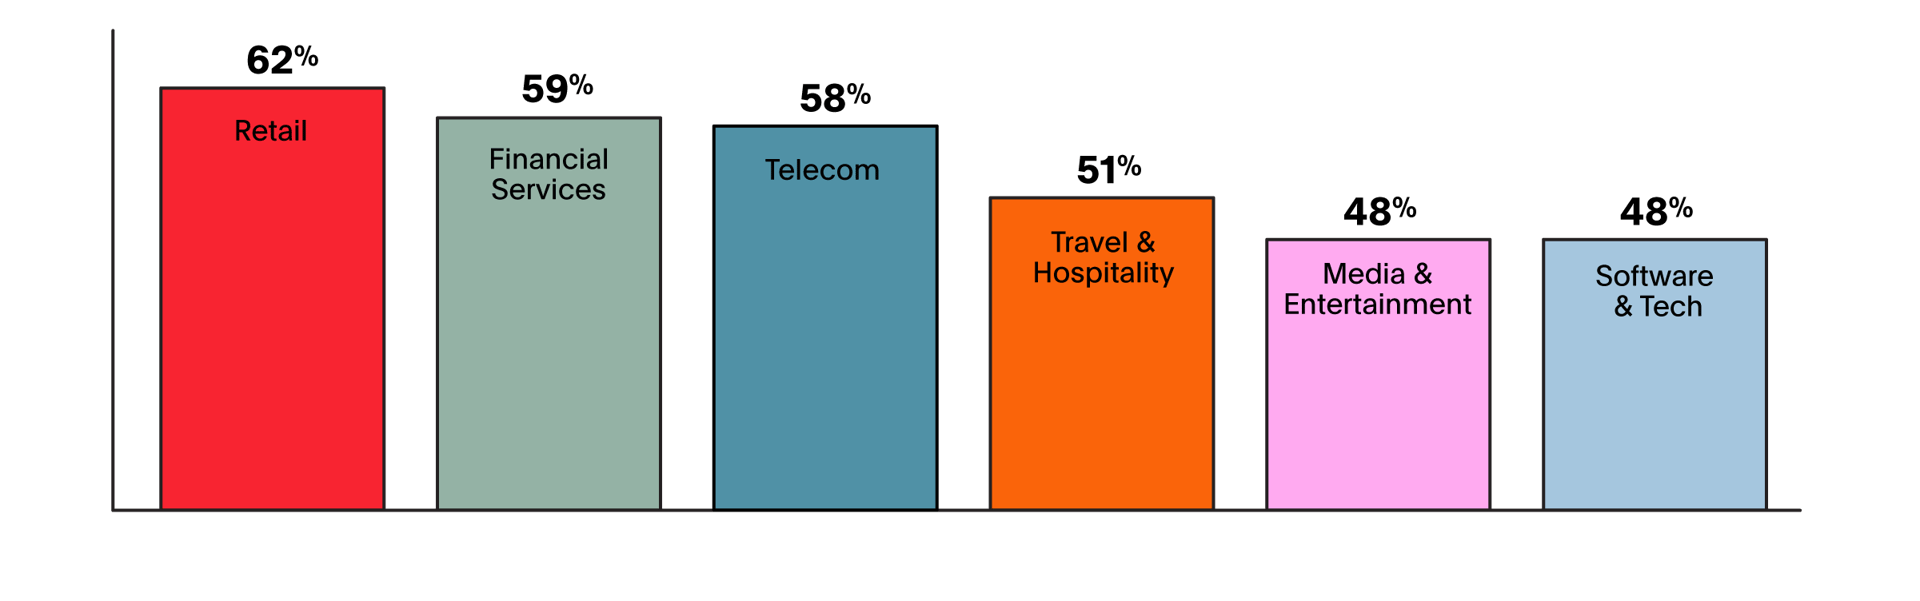
Across all industries, 54% of responders are being interrupted outside of normal working hours.
In the first edition of our report, we looked at how Working Hour Consistency was impacted by the first months of the global pandemic, finding that some employees were working considerably longer hours than they had been in the 12 months prior to the pandemic. We’ve looked deeper into this metric to see how employees are continuing to be impacted.
Working Hour Consistency is the long-term predictability of a team member’s workday - how many hours they can expect to work and when those hours will happen. When incidents happen outside of those work hours, the team members involved in resolving the incident will see a decrease in their workday consistency. We looked at employees experiencing interruptions - non-email notifications that something needs attention. These notifications might be a push notification to their mobile device, SMS, or a phone call.
Every industry has some disruption due to after-hours incidents or interruptions. Across all industries, 54% of responders are being interrupted outside of normal working hours. Teams in the Retail industry experienced the most disruption. Retail digitization and the increasing uncertainty of supply chain disruptions in 2021 has changed the retail landscape significantly from where it was in 2019.
Retail experiences the highest number of team disruptions outside of working hours
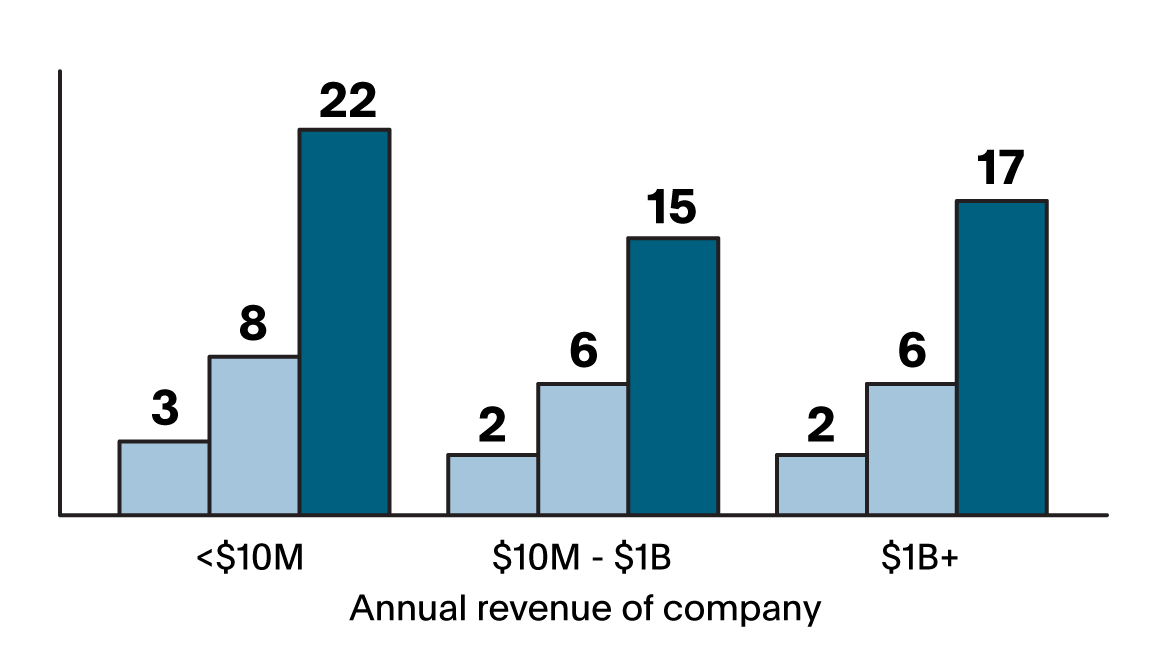
Responders in the smallest organizations are being hit the hardest with interruptions.
When looking at the number of off-hours interruptions employees responded to over 2021, we grouped responders into cohorts and compared those employees to a median, representing the 50th percentile. For this data point, the median number of interruptions per responder per month is 2.
The uppermost cohorts of responders experienced far more interruptions. We categorized the 75th percentile of responders as “Overworked” and the 90th percentile as “Burned Out”. These cohorts experience several times more interruptions compared to the median.
We first looked at these cohorts grouped by revenue, as a proxy for the size of the organization. We saw that in both the Overworked and Burned Out cohorts, responders in the smallest organizations are being hit the hardest with interruptions. While all organizations have a similar number of interruptions, smaller teams may not have as many responders to take on call duties and may have limited ability to apply resources to improving the reliability of the systems they are managing. Larger organizations may be dealing with more systems and complexity, as well as coordination among teams.
Organizations of all sizes and industries are feeling the crunch on their time.
Average monthly off-hours interruptions for incident responders
When we look for trends across industries, we find Financial Services employees are seeing more off-hours interruptions than those in other industries. Customer demands and system complexity in Financial Services can create a very high-stress environment for employees.
Average monthly off-hours interruptions for incident responders
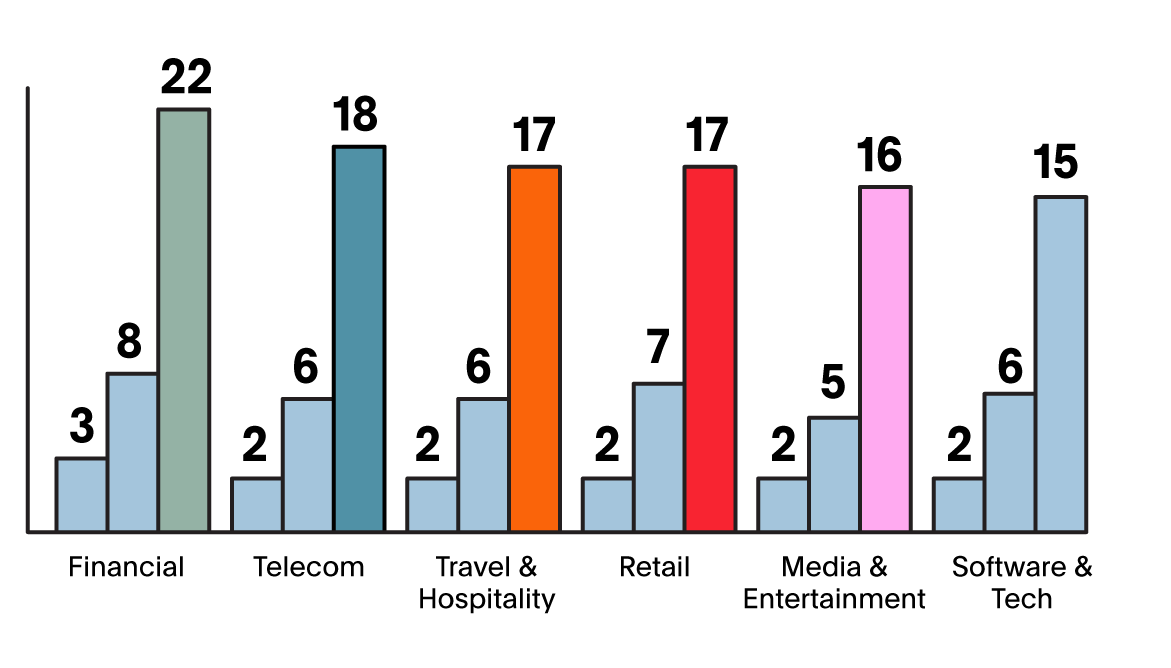
Overall, Overworked and Burned Out responders are bearing the burden of off-hour interruptions across industries and across revenue segments. Organizations of all sizes and industries are feeling the crunch on their time when it comes to responding to incidents.
3. Burnout and attrition
"Lack of continuity of the roadmap has created additional work and churn. I have inherited many responsibilities that are not really in my job description to make up for missing roles."
Survey respondent
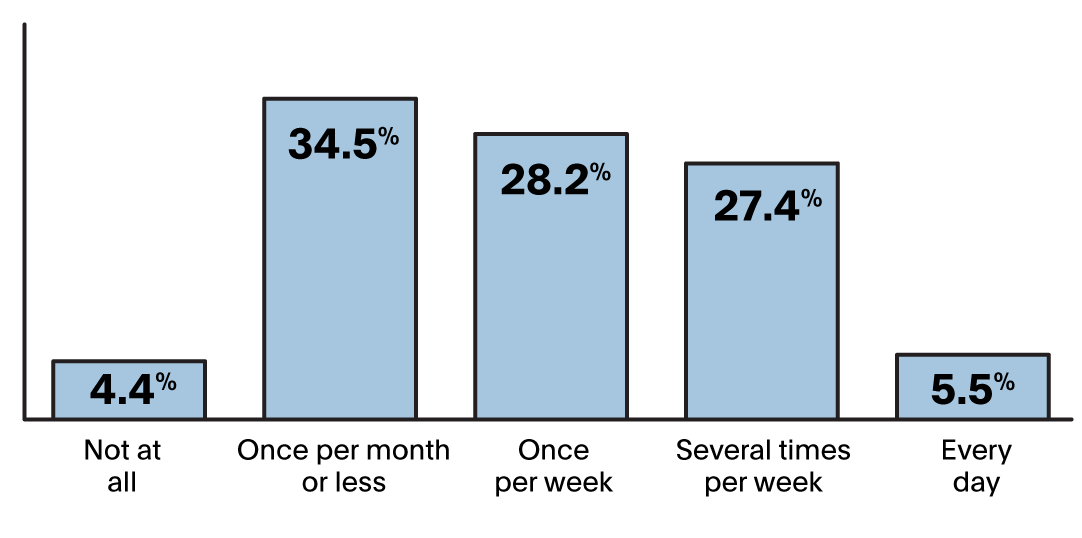
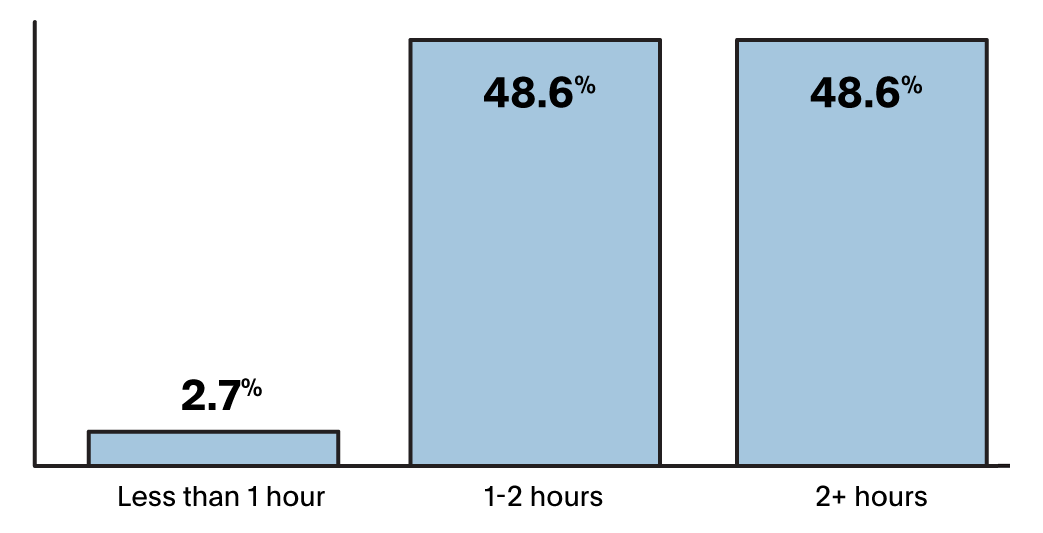
How often do you respond to alerts outside of working hours?
42% of participants are working more hours in 2021 than 2020.
Our survey results support what we see in the PagerDuty platform data: employees are seeing disruption during their off hours. We asked “How often do you respond to alerts outside working hours”, and less than 5% of survey respondents responded “Not at all”. More than 60% reported responding to off-hours alerts once a week or more.
These interruptions add up. Overall, 42% of participants are working more hours in 2021 than in 2020, while only 6% reported working fewer hours. Our earlier findings indicate that employees were already working 2+ hours more in 2020 than they did in 2019, so we’re seeing a significant increase in hours worked over the two-year period. Respondents who reported that their teams had seen turnover in 2021 also reported working more hours. This cycle can easily continue: employees feel burned out and leave; remaining employees work more hours; employees feel burned out and leave… As the cycle continues, organizational knowledge and expertise is lost. Recovering from this cycle in a tight labor market may be difficult for some organizations.
"Some people have too much on their plates because we tend to work in silos and not all silos are created equally. I think this has created some animosity in the group."
Survey respondent
Respondents are being given less time to rest between on-call shifts.
Survey respondents detailed some of the qualitative impacts increased turnover has had on them and their teams. Included in their responses were "more on-call shifts", "higher workload", and "increased MTTR".
Respondents reported they were given less time to rest between on-call shifts and increased job responsibilities. Respondents on teams that had experienced turnover in 2021 were also more likely to have seen an increase in critical incidents, implying that as the cycle continues, organizations can expect to see more alerts and interruptions that impact their business applications. Our data shows that overall, critical incidents have increased 6% in 2021 from 2020.
Are you working more or less hours than 2020?
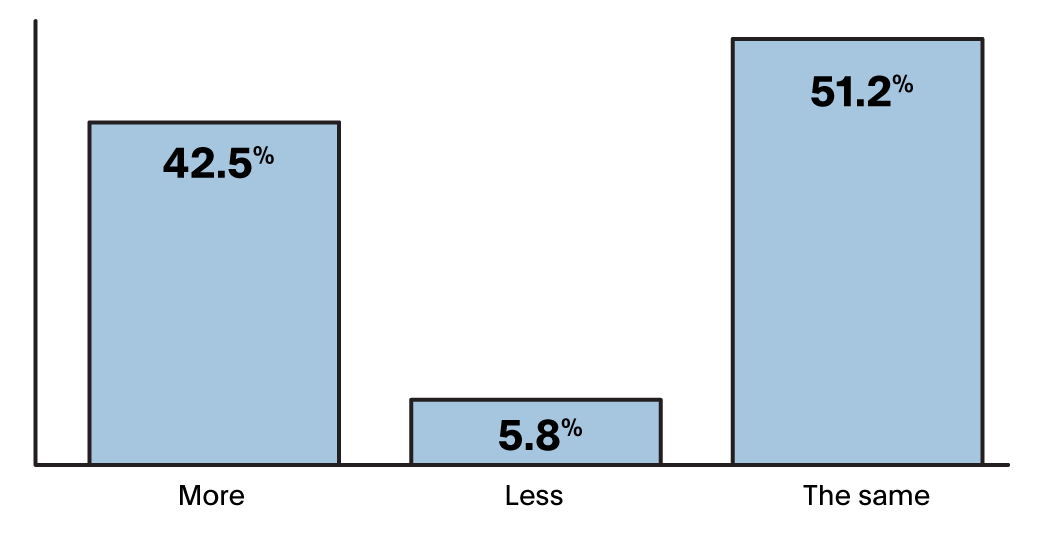
Are you working more or less hours than 2020?
4. Incident response improvements
"Burnout ensues if we don't constantly evaluate how our oncall is performing, how best to carry over alerts that take more than one shift to accomplish, statistically categorize False Positives, and tune detections."
Survey respondent
Organizations are seeing significant improvements in MTTA and MTTR.
Organizations are improving their incident response practices. While personnel issues may continue, teams have opportunities to improve their processes to tackle complexity.
In our first edition, we looked at the overall impact of tenure on the PagerDuty platform on MTTA and MTTR. Organizations see significant improvements in these metrics the longer they use PagerDuty. While this is definitely good news, we wanted to see how the rate of improvement compares across revenue segments.
MTTA improvement by tenure
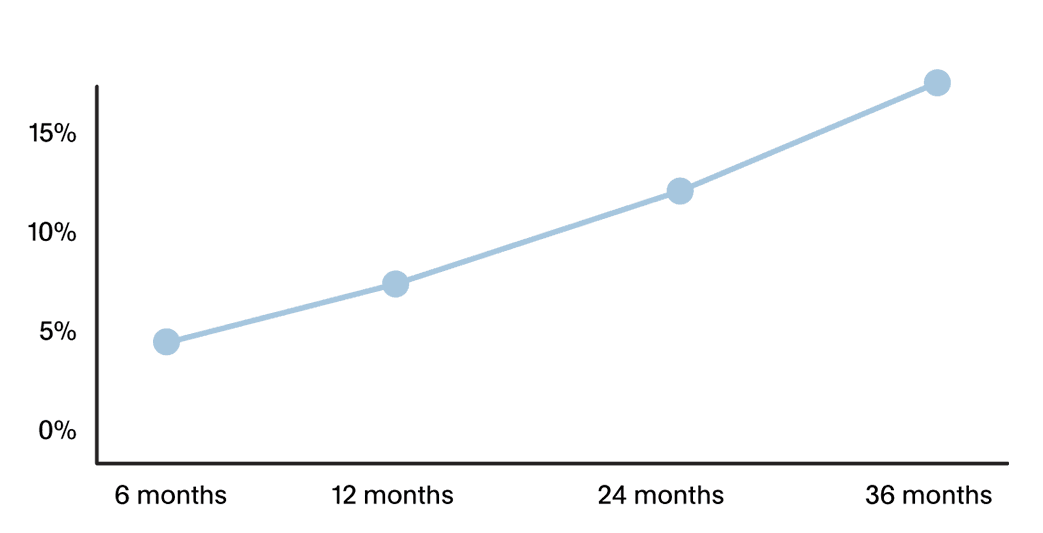
MTTA improvement is linear over time.
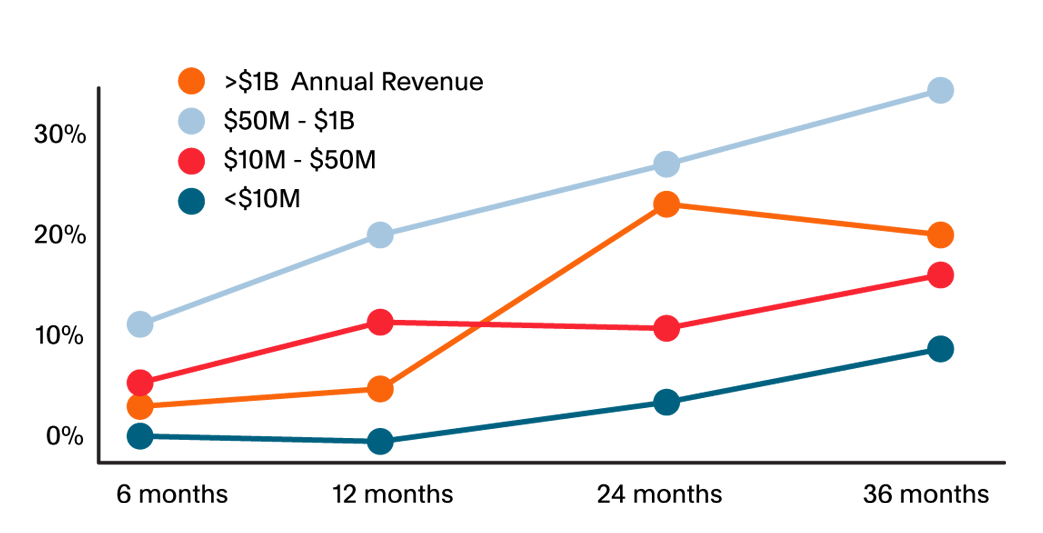
We looked at a three-year period starting 6 months after an account is opened. Overall, we see a fairly linear improvement in MTTA over time. After 36 months, organizations are seeing a 17% improvement in their MTTA. By revenue segment, we see the highest percentage of improvements in MTTA for upper mid-market companies, reaching 29%, while lower mid-market accounts saw the lowest improvement, at 8%.
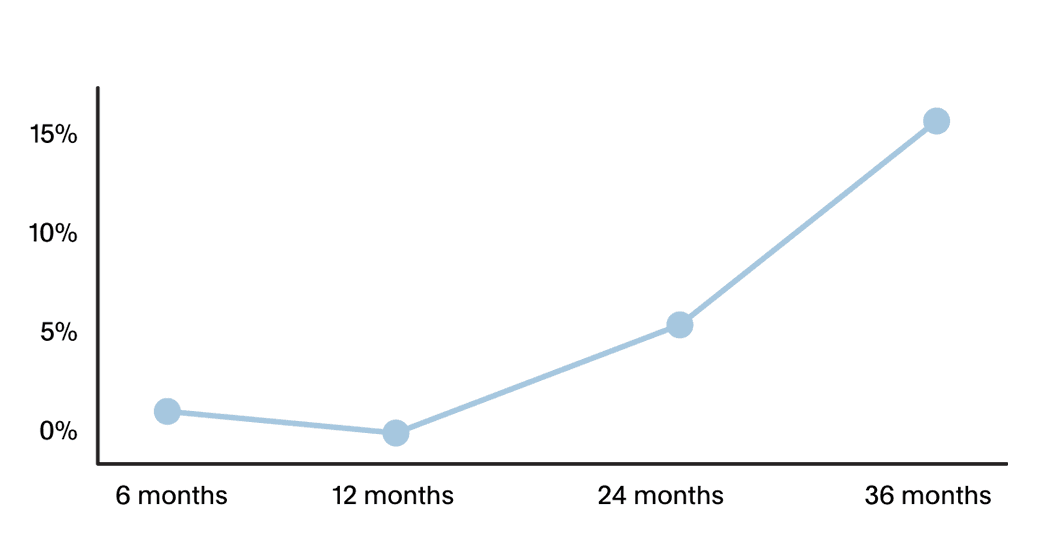
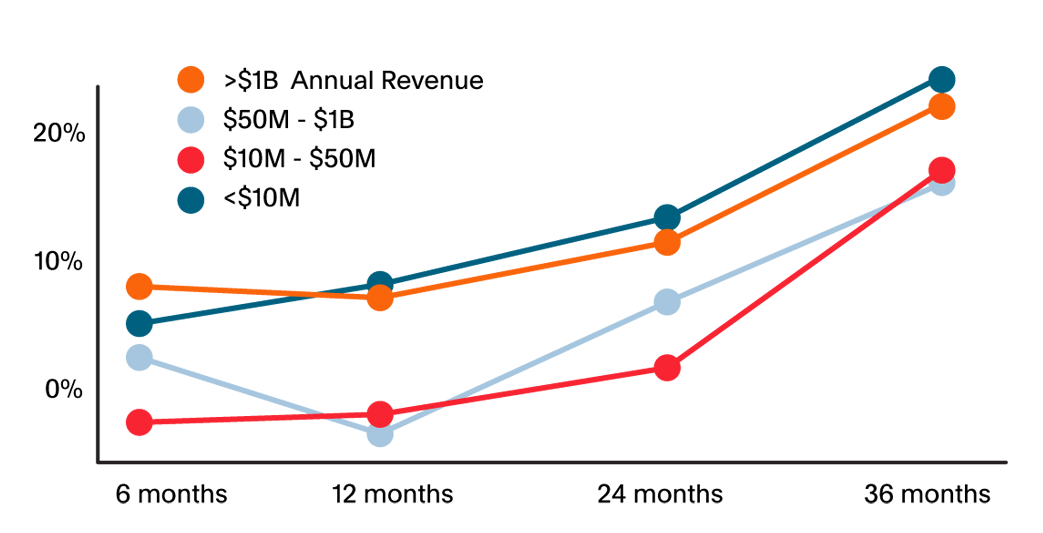
MTTR improvements start slower but ramp up quickly after two years.
When we looked at MTTR for the same time scales, the story is different. At first glance, the graph looks like it could be exponential! A closer look tells us that accounts of the smallest companies struggle early in their use of PagerDuty to really secure improvements in their MTTR, and have negative improvement at the start of their use of the platform before reaping the bigger benefits after two years.
MTTR improvements by tenure
MTTA improvements by tenure
MTTR improvements by tenure
As we saw with off-hours interruptions, smaller companies with fewer resources are stretched thin. It may be taking them longer to devote time to making improvements to the reliability of their services and use of PagerDuty.
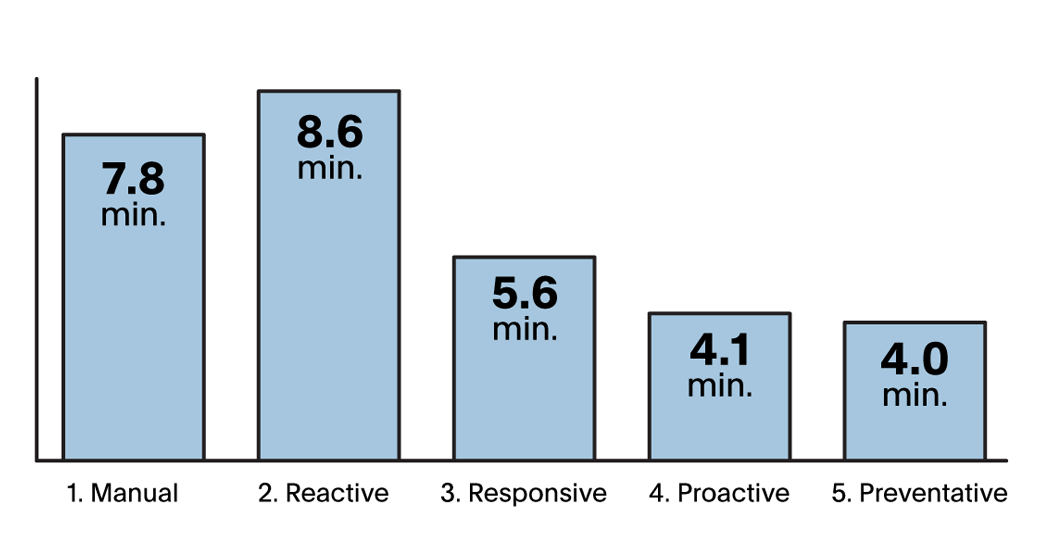
Organizations experience lower MTTA as they mature operationally
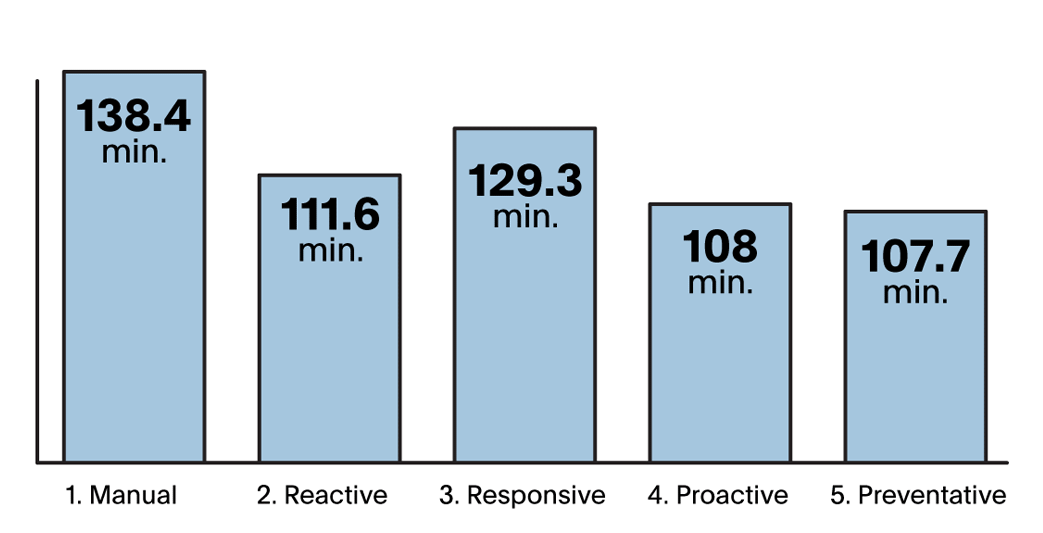
Organizations experience lower MTTR as they mature operationally
Industry insights:
travel and hospitality
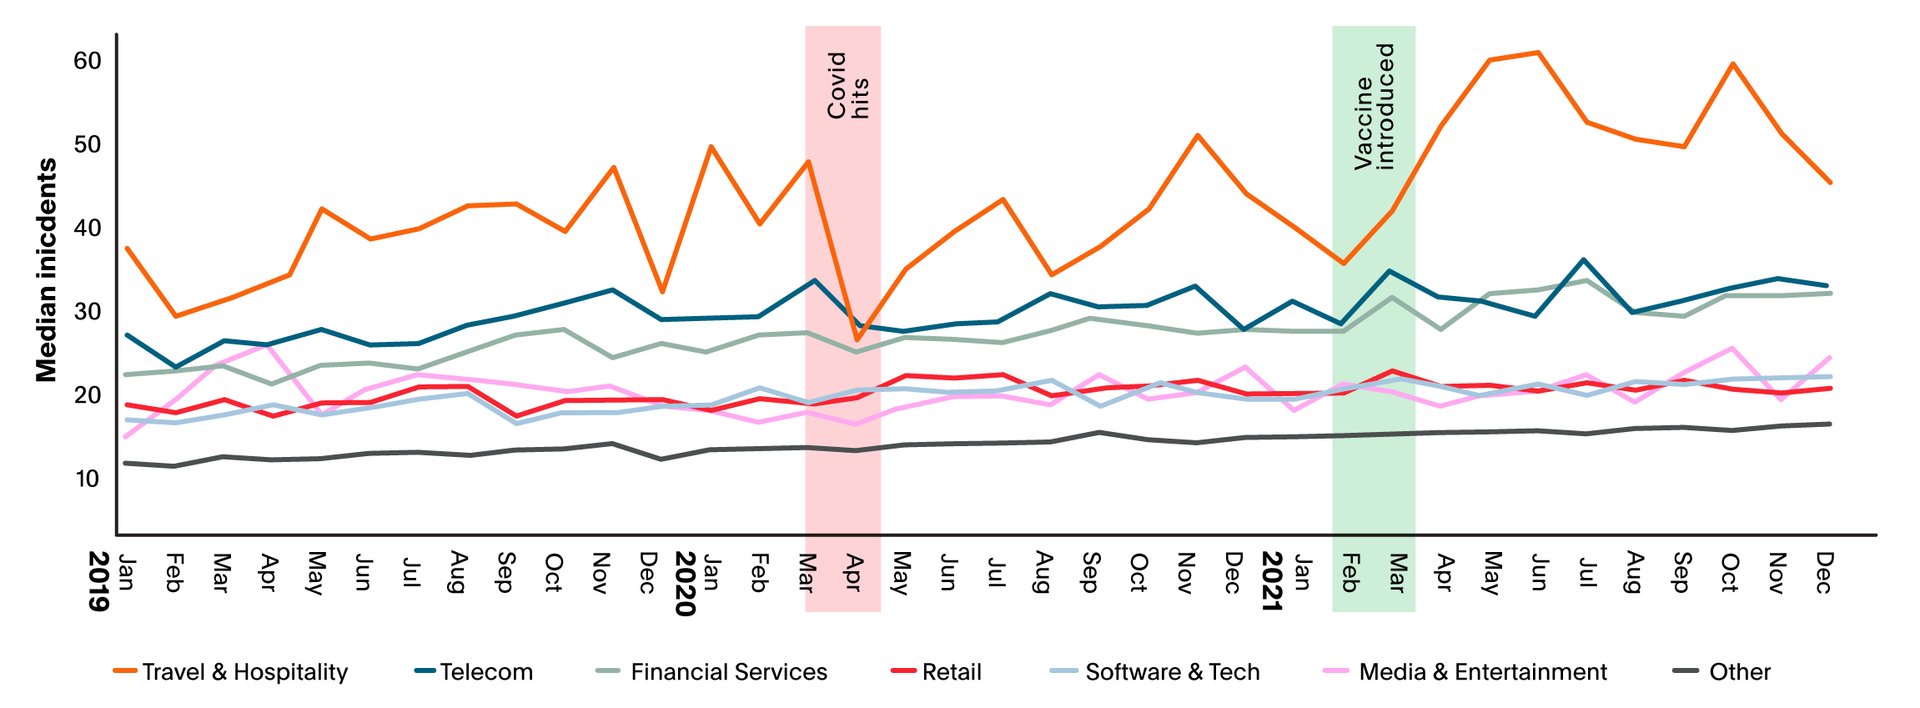
Travel and hospitality has seen the most monthly incidents across all industries.
When we think about the origins of incidents, we know that many of them are caused in some way by change - in the services, in the environment, in other conditions that the services run under. We wanted to look a little deeper into an industry that has experienced a lot of disruption and change during the pandemic, Travel and Hospitality.
Travel has been impacted by the pandemic over and over again, as the initial lockdowns and travel restrictions lifted, or partially lifted, in various places, through the later pandemic waves caused by variants of the initial COVID-19 virus. As travelers made plans and postponed them over and over, the uncertainty in the industry remained in the news for most of 2020 and 2021.
As vaccines became available in early 2021, and more widely in the third quarter of the year, companies in the travel industry raced to provide their customers with UI and app updates to upload their vaccination status. Holiday 2021 travel was impacted by the Omicron variant, with companies struggling to find enough staff to meet the needs of customers.1
Our data shows that Travel and Hospitality has seen the most monthly incidents across all industries, far above even Retail, another industry deeply impacted by the pandemic due to not only front-line employees and staffing but also the continuing supply chain issues worldwide.
Median monthly critical incidents per account