- PagerDuty /
- Engineering Blog /
- Lessons from PD Labs: From experimentation to a production-ready SRE Agent
Engineering Blog
Lessons from PD Labs: From experimentation to a production-ready SRE Agent
by PagerDuty Engineering
November 3, 2026
| 17 min read
Introduction
At PagerDuty, we are pursuing multiple research and development initiatives. This article provides a high-level overview of our SRE Agent developments and highlights how these efforts help us build an industry-leading solution.
While creating a custom agent and connecting it to existing tools is relatively straightforward, simple agents fall short during active incident response. Transitioning from a prototype to a fully functional, production-ready SRE agent requires significant effort and can easily distract from your core business objectives. Here are some examples of requirements we deemed to be relevant for an SRE Agent:
- Isolation: Custom-built agents must remain isolated from primary systems so they stay operational during system outages.
- Proactive Triage: The agent should initiate investigations immediately upon alert triggering, well before a human responder is paged.
- Customization: Different engineering teams require distinct configurations and agent behaviors tailored to their workflows.
- Context Awareness: During long-running incidents, the agent needs to continuously adapt to war room discussions, shared notes, and uploaded artifacts.
- Guardrails & Governance: Fine-grained controls are necessary to specify permissible autonomous actions versus operations requiring explicit human approval.
- System Mapping: The agent must understand complex, distributed architectures, even when documentation is outdated or incomplete across infrastructure and application layers.
- Transparent Reasoning: Root cause analysis must clearly articulate tested hypotheses, supporting evidence, and confidence metrics for its conclusions.
- Up-to-date models: Continuously updating the models behind the scenes and picking the best model for the task
PagerDuty’s SRE Agent is engineered to solve these challenges. The following sections detail our technical approach and trace some of our ongoing efforts to advance automated incident response. The initiatives below all had their origin in PD Labs, and some have already graduated into our main product.
SRE Workbench
AI Agents are fundamentally changing how we work and can significantly disrupt traditional incident response. Serving as one of the first experiments in PD Labs, SRE Workbench is designed as a new way to work an incident: a user interface and experience where agents and humans work side by side. In the workbench, you have a shared workspace that contains information about the incident investigations, whether these are done by humans or agents. This minimizes the cognitive effort of looking at symptoms and evidence (e.g., alerts, deploys, dashboards, logs) associated with an issue. In the workbench, users can interact with PagerDuty’s SRE Agent, start an investigation, view a timeline of key moments, check service dependencies, and add new artifacts such as notes, links, etc. visible to all and that are kept as part of the issue.
Let’s dive deeper into some of SRE Workbench’s functionality.
Deep Investigation
When our SRE agent starts investigating an issue, it forms several hypotheses about the probable root cause. These span both how the system is built and how it is behaving right now: infrastructure, observability signals, application configuration and code, upstream and downstream dependencies, previous incident history, and runbooks.
Finding a root cause breaks down into two steps: first localizing the component where the fault originates, then determining what went wrong inside it. At any point in an investigation, the agent is therefore holding several candidate explanations, each with its own confidence level.
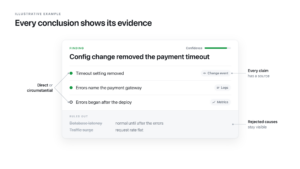
Every hypothesis has to be grounded in evidence. Each piece of evidence links a specific claim to the source it came from, such as a log line, a metric, a deploy event, or a line in the incident transcript, and is classified as either direct or circumstantial. Direct evidence observes the fault mechanism itself: a configuration change that removed a required setting, or an error that names the failing dependency. Circumstantial evidence is consistent with a hypothesis without proving it: an error spike that lines up in time, or a service that alerted at the same moment. Circumstantial evidence is useful for deciding where to look, but treating it as proof is how agents reach confident, wrong conclusions. In one of our benchmark incidents, an early version of the agent blamed a symptom that happened to co-occur with the failure, rather than the configuration change that actually caused it. The agent also records the alternatives it rejected, and the evidence against them, so responders can see what was ruled out as well as what was concluded.
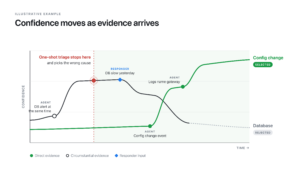
Evidence also arrives over time. When an investigation starts, the signals needed for a conclusive diagnosis may not exist yet, and symptoms can shift as the incident unfolds. So the agent’s work doesn’t stop after initial triage: it keeps gathering evidence and revising its hypotheses for as long as the incident is active.
As incident response unfolds over time, responders gather evidence, test explanations, and change direction as they learn more. An agent helping with that work needs to stay useful for minutes or hours, while the incident and its context keep changing.
Deep Investigation started as a PD Labs initiative to improve our root cause analysis capabilities. As part of that, we noted the importance of having the agent refresh its context and keep up with all that is happening related to the incident. It’s also a testbed for a question we continue to explore: which combinations of models, tools, data, and agent architecture actually help diagnose incidents with the highest performance. In this case, performance goes beyond getting to the right root cause and includes, for example, not misdirecting the user.
Following and steering the investigation
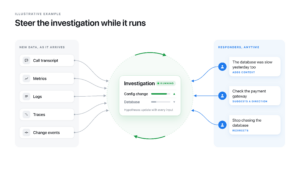
The agent is designed to stay active throughout an investigation, incorporating incident transcripts, responder notes, metrics, events, logs, and traces as they become available. It develops hypotheses from that evidence and revises them as new information arrives, without requiring a responder to prompt every step.
Responders can steer the investigation while it runs: introduce context, suggest a direction, or redirect the agent when an explanation no longer fits. That combination of independent work and human guidance is central to the design.
Keeping the architecture open
We built the system with as few assumptions as practical about the underlying model, available tools, and how work is divided between agents. These are choices we want to test, rather than commit to early.
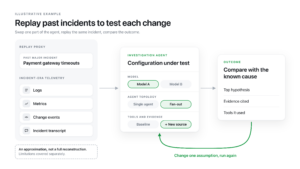
For example, we’ve compared an initial fan-out architecture, which distributes investigation work across multiple agents, with a single-agent version across different model classes. Being able to change the topology and rerun evaluations makes these architectural choices testable. It also gives us a way to evaluate new models and techniques without rebuilding the surrounding system.
The investigation is independent of its interface. Responders can access it through SRE Workbench, Slack, or through MCP. We’ve also deployed it internally through a Claude Code skill. The skill polls the investigation agent and brings new evidence and findings into the responder’s session as they become available. This approximates streaming through periodic updates, letting responders use the investigation alongside their existing coding tools and systems access.
Testing as we build
Development runs alongside regression testing against past major incidents and live benchmarking. For historical tests, we use a replay proxy to expose incident-era telemetry to the agent, approximating an investigation at that point in time.
That is not a complete reconstruction of the original incident. The replay’s limitations matter when interpreting results; we’ll cover those and the benchmarking approach separately.
The goal is to make iteration cheap enough that we can test architectural assumptions, compare model capabilities, and establish which tools and evidence improve an investigation.
Topology
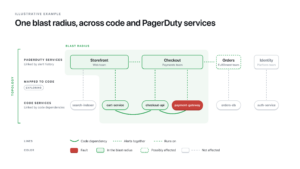
Root-cause analysis tools and, increasingly, LLM-based incident-response agents assume someone can hand them a service dependency graph. The assumption matters most in the incidents that are hardest to diagnose: the ones where the service that alerts is not the service that failed. A checkout API times out because a queue two hops away stopped draining, or because a database it shares with another team was migrated overnight. An agent that only sees the alerting service will explain the symptom, and do so confidently. With the graph it can walk upstream to the candidate causes and downstream to the blast radius, and test both against runtime evidence, as well as provide you better insights for remediation.
There are a few ways to get a dependency graph today, and each has a cost. You can ask an LLM agent to generate them. That works on a small estate, but it is slow and expensive to repeat, the answer changes between runs, and there is no way to check it short of reading the code yourself. You can rely on distributed tracing, which is expensive and only records real calls, but only the sampled fraction of paths traffic happened to exercise, only where instrumentation exists, and nothing about the queues and databases behind a service. Or you can document the architecture in a wiki or a catalog like Backstage. Those are accurate the day they are written and drift from then on, because nothing forces a change in the code to update the entry.
We opted for using code, configuration and infrastructure definitions to capture what we seek to describe in a system graph. For most cases, these definitions are versioned, and when you change it we can update the dependencies and the graph.
Building the graph from what teams already have
We build the graph using a hybrid approach that combines static analysis with generative models. A collector parses each repository’s source, deployment configuration and infrastructure definitions with language-aware extractors and records every dependency site it finds as a fact: this service calls that host, publishes to that queue, reads from that database, each with the file and line it came from. Much of what a single repository says about its dependencies is indirect, an environment variable here, a Helm value or Terraform output there, so a central engine joins the facts from all of an organization’s repositories and resolves those references across the whole estate. The result is an architecture diagram in a form an agent can query: the services, the databases and caches each one uses, the queues and topics that connect them, and the external APIs they depend on. The agent can show a responder exactly why it believes two services are connected since every dependency carries a confidence, derived from how it was established and the chain of evidence behind it. In most situations no agent is involved in building the graph, thus the same repositories yield the same graph, and the graph exists as soon as the collector has run once, before any tracing or catalog is in place.
Teaching the engine new idioms
Static analysis has a known limit: it recognizes the frameworks and languages it has been taught, and new ones appear often. We built the engine so that AI agents can do much of that teaching. Offline, an agent inspects repositories and identifies dependencies it could not resolve, works out the library or idiom involved, and proposes a generalized extraction rule, extending the engine. Unless the engine encounters a more uncommon framework or language, the agent does not need to touch the graph at runtime. With this approach, we observe a transfer learning effect across services. For example, if you built a custom library to handle HTTP requests, the engine only needs to learn it once to be applied to all services.
Running it on our side or on yours
The collector can run via a code integration such as GitHub, where each repository is inspected inside a security enclave that holds the code only for the duration of the run and discards it afterwards, and no one at PagerDuty can see inside. Or, for organizations that prefer to keep the process in-house, they can run the same collector in their own CI, or from the command line, at the cost of the continuous updates the integration provides. In every case, the only thing that reaches PagerDuty is the set of facts: relations between services, hosts, queues and databases, with file and line references.
Evaluation of the created topology
To understand how good our approach was, we measured the graph against two corpora with system dependencies validated by hand. The first corpus is composed of 50+ systems, where each has several open-source microservices. These were chosen due to the spread across languages and platforms. Here, the engine reaches an F1 score of 0.93 on their known dependencies, and the majority of the systems come out with every dependency found. The closest published state of the art for statically recovering service dependencies is Code2DFD1. However, this is measured on 17 Java-only apps and achieves a lower F1-score of 0.86. The second corpus is our own estate, where it scores the same 0.93, with almost no false dependencies. We also measured against our internal fleet of 500+ repositories with an F1 score of 0.94. As far as we know, these are the first accuracy figures for dependency inference reported on a private production estate, and they carry more weight than the open-source ones, since none of this code was available to any model during training.
Blast Radius
A key component of the SRE Agent is the initial triage and how much value it can add as early as possible. When a service reports a problem, responders need to understand how far it might extend. Which other services could be involved? What part of the business might be affected? Today, have two approaches to calculate this: 1) an event-based approach that we describe below and 2) using system topology to infer blast radius. Although these are different approaches and explore different signals, we plan to unify them over time.
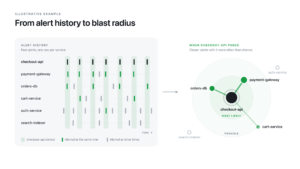
Event-driven blast radius explores how much of that context we can derive from PagerDuty’s existing event data. Patterns in how services alert, including which services tend to alert together, can reveal relationships worth investigating during an incident.
Learning from event history
These relationships provide a different signal from code dependencies and service topology. A dependency graph describes how services connect; event history shows how their reported problems relate in practice.
The distinction matters. Services might alert together because one depends on another, because they share infrastructure, or because both are affected by the same external event. Co-occurrence alone doesn’t establish a dependency or prove that a fault has propagated. It gives responders additional context about where to look.
This is an example of the broader work we’re doing in PD Labs. Some useful capabilities start with applying data science to information PagerDuty already collects. Agents can use the resulting signals, but those signals can also help responders directly.
Connecting technical faults to business impact
We’re also exploring whether these patterns can help infer relationships between PagerDuty services and, eventually, map them to the code services behind them.
Those mappings could help connect a technical fault to the organizational or business functions it affects. For a large customer, identifying a failing code service and understanding who depends on it are often separate, difficult tasks.
Event data won’t resolve that mapping on its own. It offers another source of evidence we can combine with topology and service context to make the connection clearer.
Continuous Improvement and Benchmarking
SRE Agent has emerged as a new market category, and most companies with digital services are looking to buy or build one. Evaluating its operational effectiveness is far from straightforward, as varying telemetry signals and complex underlying issues can obscure true performance. As we added capability to our agent, we needed a reliable, repeatable way to measure whether each change made investigations better. Replaying past incidents is useful but has limits since post-incident reviews may only tell part of the story, hindsight leaks into the replay, it is complex for third-party agents to use the replays in a fair way, and you only get the incidents you happened to have. We also evaluated existing public benchmarks and they typically run on public demo apps that models have already memorized from training data, rarely include source code as an evidence source, assume structured outputs that third-party agents can’t be forced to produce, and often rely on a single fault-injection mechanism.
For these reasons, we built our own benchmark harness: a purpose-built system of interconnected Kubernetes microservices (Go, Python, TypeScript, Elixir; Kafka, Redis, PostgreSQL) running on EKS, instrumented to emit metrics, logs, and traces to Grafana Cloud, with alerting wired to PagerDuty. Because the codebase is private, it can’t have leaked into model training. Faults are injected through four mechanisms: Helm overrides, Chaos Mesh, PR merges, and AWS control-plane changes. And we apply four scenario categories: configuration, code, data integrity, and operational faults, often designed so the symptomatic service differs from the causal one.
We designed the benchmark to be as fair and neutral as possible, since we are both building and testing agents. Every agent (PagerDuty SRE Agent alongside leading coding agents and other SRE agents) investigates the same live fault with the same data access, using consistent prompting. Responses are scored by a three-model judge ensemble from three different providers against pre-defined per-scenario criteria, across several metrics: diagnosis of root-cause analysis, localization of the issue, mitigation recommendation quality, misdirection, and latency. A contamination scanner runs on every sweep to catch answer-key or source leakage.
This benchmark was created with the following goals in mind: 1) improve our multi-agent design and algorithms by having a fair comparison with competing solutions; 2) set the standards for how to benchmark this emerging field of SRE Agents
On the latest 17-scenario benchmark run, PagerDuty SRE Agent’s Deep Investigation mode had some of the highest scores. However, earlier runs exposed weaknesses in our original complex multi-agent design. It was ranking mid-field on some incident types, and it was too slow and expensive. These results helped us steer our research work and motivated a rebuild of parts of our agents, yielding a roughly 20-point diagnosis score improvement while making the agent faster and cheaper. Additionally, it allowed us to compare model performance in investigation work and to make the right trade-offs between accuracy, latency, and cost.
Before having the benchmark, we were using incident-replay analysis of our own incidents. When comparing both, we identified a certain level of bias created by that framework, but we also noted the increased value of using live human input data (adds 5pp to agent score), which is a signal that our benchmark can’t yet reproduce, and it shows the potential of having a richer and more complete agent harness.
Next steps include:
- Understanding better the value of different signals such as system topology
- How information such as traces compares to having just logs and metrics
- Model and harness differences
- Introduce more scenarios and add further complexity to the system
You can view a detailed report on the benchmark’s methodology and results here.
Final remarks
SRE Agents are a new emerging market. This document gives a high-level view of some of our related lines of research and what parts of the product are coming from PD Labs. It covers the challenges of building an SRE Agent and benchmarking it, how we evolve it, and how we can complement it with information like topology and capabilities like blast radius analysis. We will be sharing more detailed articles about some of the topics above and also new ones! Stay tuned!
Want to try out SRE Workbench and the other features you read about? Waitlist sign up is open now at https://www.pagerduty.com/pd-labs/
References
1 Schneider, S., Bakhtin, A., Li, X. et al. Comparison of static analysis architecture recovery tools for microservice applications. Empir Software Eng 30, 128 (2025). https://doi.org/10.1007/s10664-025-10686-2