
- PagerDuty /
- Blog /
- Automation /
- Quick! Grab all the evidence: Capturing application state for post-incident forensics.
Blog
Quick! Grab all the evidence: Capturing application state for post-incident forensics.
by Jake Cohen
February 9, 2023
| 5 min read
This is the first in a multi-part blog series. In the next blog, we’ll provide a template job that leverages Kubernetes Ephemeral Containers to capture evidence from applications running in Kubernetes.
Everyone loves a good mystery thriller. Ok, not everyone – but Hollywood certainly does. Whether it’s Sherlock Holmes or Hercule Poirot, audiences clearly enjoy a page-turning plot of hunting down the culprit for some heinous crime. Many individuals, myself included, prefer the mystery-thriller where, at the end of the story, the mystery is “solved.” While cliff-hangers can evoke your imagination to think through the probable outcomes (remember the end of Chris Nolan’s Inception?), when it comes to detective stories, I admittedly prefer to know the answer of “who dunnit.”

Source: https://www.dazeddigital.com/artsandculture/article/24949/1/christopher-nolan-explains-the-spinning-top-in-inception
For a detective story to have full closure, the evidence of the crime is ideally crystal clear and provided in great detail such that the true culprit will be uncovered and hopefully brought to justice.
In the world of technical operations and maintaining uptime for critical services, a clear conflict arises that is akin to the Hollywood detective story. When critical applications suffer performance degradation—or worse yet, a full outage—engineers rush to find the (apparent) cause of the incident, such that they can remediate the issue as fast as possible. Teams will use the tools at their disposal to track down and isolate the overloaded compute resource, the hung query, or the maxed-out queue and quickly take action to rectify the issue.
As it turns out, however, this is only the beginning of the detective thriller. This is the type of detective mystery where the witnesses perceive the culprit to be the person who happened to be in the wrong place at the wrong time. But as more evidence is uncovered, it eventually becomes clear that the “true culprit” was an evil mastermind puppeteering a grander scheme from afar. Unfortunately for our “detective” engineers, when the (apparent) root cause is remediated, there is a high likelihood that they have [un]knowingly eliminated evidence that points to the underlying culprit: restarting a service or redeploying a pod eliminates valuable forensics evidence.
You can imagine the chief inspector pulling their hair out when they realize that poorly timed rain washed away the fingerprints that would have given them their strongest lead.
Source: https://www.defendyourcase.com/criminal-defense-blog/2020/february/are-fingerprints-at-the-crime-scene-enough-evide/
These days, developers and operations engineers struggle with this same tug-of-war between restoring services as quickly as possible while not losing critical evidence that would help them identify the code-level root cause of their incidents.
But wait—isn’t that what monitoring tools are for? The answer is: sometimes. Depending on the issue, configuration or code-level errors can be tracked down using sophisticated observability tools. However, developers often need even more granular data that isn’t captured by monitoring tools—simply because this debug-level data isn’t needed for alerting or service restoration. Data such as heap, thread, and TCP-dumps, top resource-consuming database queries, and stack traces are used to identify the “true culprit,” but most often are not needed to restore-service. Gathering this data takes time, and we all know that, during an incident, restoring service availability takes precedence over everything else.
Unfortunately, the adoption and proliferation of containerized applications and container orchestration has only heightened this tug-of-war struggle for two primary reasons:
- Microservice architectures provide faster methods for safely restoring availability, such as redeploying a pod.
- Fewer debugging utilities are available in these environments since developers and operations engineers want to minimize the surface area of their container images.
In order to accommodate the opposing forces in this tug-of-war, a solution is needed that can take action at “instant speed” such that evidence can be captured and persisted—while also immediately restoring service thereafter:
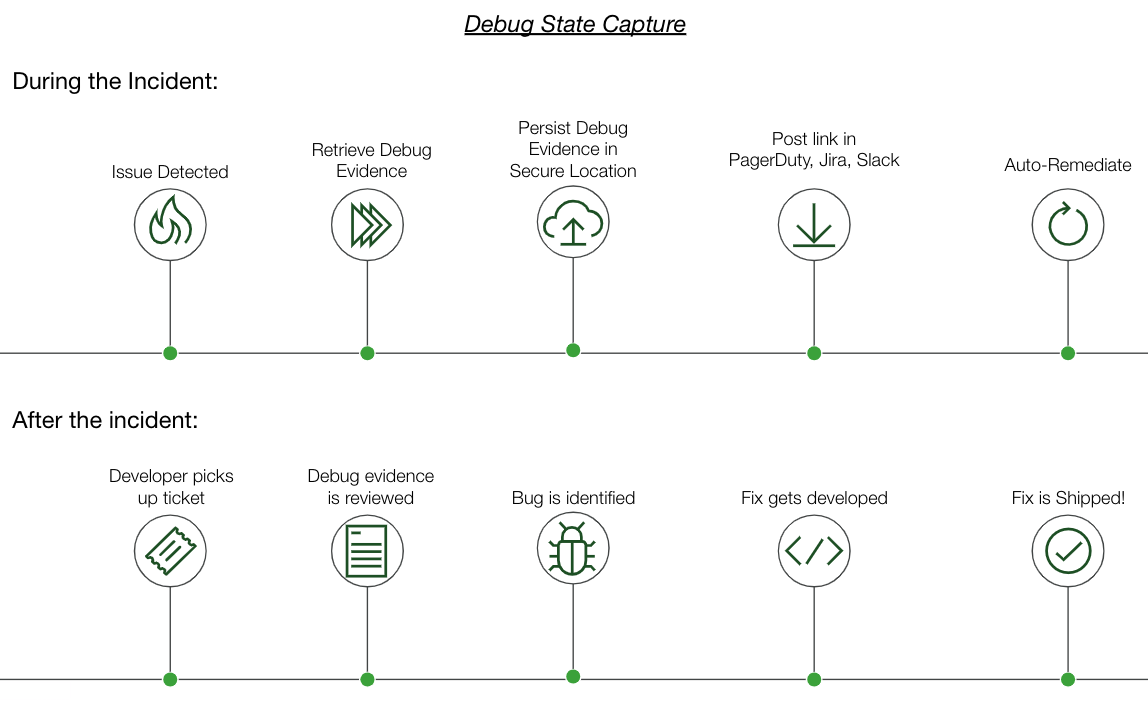
Such a solution is provided with PagerDuty’s Operations Cloud. By harnessing runbooks that are instantly triggered when an issue is detected, debug-level evidence can be captured and sent to a persistent storage service – such as S3 – and services can be restored using known fixes. With a large library of prebuilt integrations for both on-premise and cloud environments, and a growing list of template runbooks, PagerDuty users can achieve this seemingly audacious goal to cut down on both MTTR and time spent replicating bugs to resolve tech debt tickets. Existing PagerDuty customers can request a trial of Runbook Automation here, while new users can get started with PagerDuty Incident Response here.
Additionally, be sure to check out our Automated Diagnostics Solution Guide to see some of these example runbooks.
This is the first in a multi-part blog series. In the next blog, we’ll provide a template job that leverages Kubernetes Ephemeral Containers to capture evidence from applications running in Kubernetes.
Stay inquisitive, my fellow detectives.