- PagerDuty /
- Blog /
- Incident Management & Response /
- Minimizing Data Science Model Drift by Leveraging PagerDuty
Blog
Minimizing Data Science Model Drift by Leveraging PagerDuty
by PagerDuty
August 15, 2022
| 7 min read
By Thomas Pin – Data Scientist
PagerDuty has an Early Warning System (EWS) model which helps the Customer Success and Sales departments ascertain the wellness of existing PagerDuty customers based on product usage and external business factors. This Early Warning System model has become critical infrastructure and the first line of defense in identifying poor product usage that could result in account churn. The success of the Early Warning System model and great efforts of the Customer Success department have decreased our risky product usage. With such a critical model in production it is paramount that it always produces accurate scores and refreshes on a constant basis.
In January 2021, the Early Warning System model released an inaccurate customer risk score due to an upstream change which resulted in an erroneous score being live for a few days. It wasn’t until one of the Customer Success managers contacted us about the mix up that we were able to immediately diagnose and repair the model. The Data Platform and Business Intelligence team, known internally as DataDuty, was resolved to seek a solution to avoid similar snafus in the future.
The issue listed above is not unique to PagerDuty. In the data science community this would be an example of Model Drift and it comes in more forms than just upstream data changes. The DataDuty team was determined to minimize the impact of this phenomenon using automated tests and PagerDuty Alerts when these issues arise.
PagerDuty
PagerDuty’s product is the critical piece to the puzzle of being proactive in avoiding model drift. As machine learning models leverage multiple platforms it becomes impossible to ingest multiple platforms’ logs, create incidents, escalate based on priority and alert practitioners without dedicated incident triaging software, such as PagerDuty. Regardless of how robust our automated tests are, it will not matter unless we can get the results to the right person at the right time. PagerDuty has enabled our strategy to be successful and we have been able to catch any detrimental changes before a model practitioner has noticed.
Model Drift
Model drift can be broken up into three categories: concept, data and upstream, where each requires a different approach to solving.
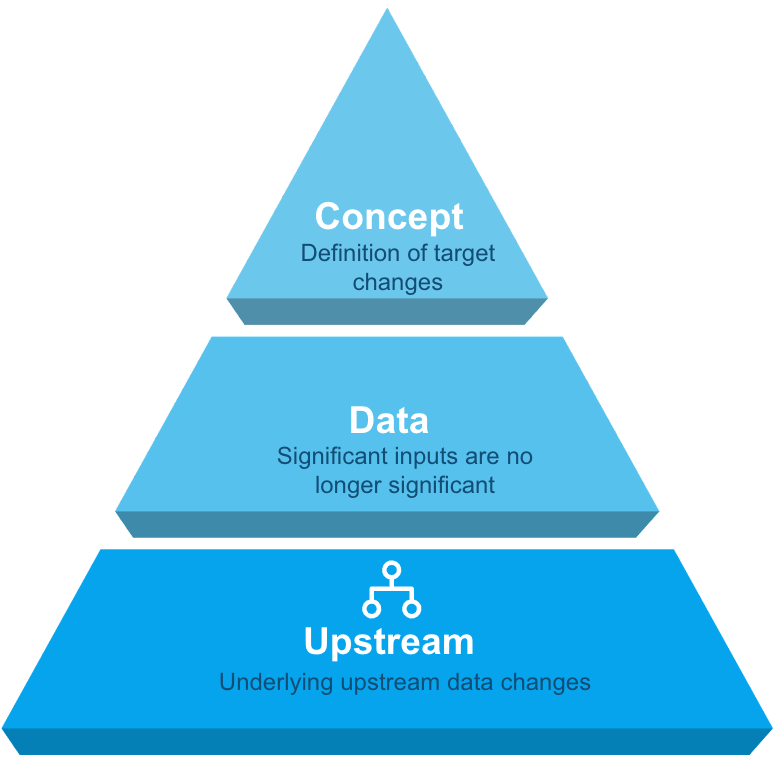 Concept: Definition of the target of the model changes
Data: Significant inputs become no longer significant
Upstream: Underlying upstream data changes
Concept Drift Tests
It is difficult to write a test to detect concept changes, as they are a construct developed by the data scientists and stakeholders. However, in the case of the Early Warning System model, the target is “churn” which has a straightforward definition. At PagerDuty, “churn” is defined as an account either being activated or deactivated and this definition has remained stable.
To measure that the Early Warning System model is predicting customer risk score correctly we have a few unit tests that are conducted:
- Prior to Early Warning System, PagerDuty had a monthly churn rate between x%-y%. Therefore, if the monthly churn rate is above z%, this would be considered an issue.
- The overall Early Warning System Scores segments have stabilized in recent years where individual account scores may increase or decrease over time. However, PagerDuty expects an allocation of 25*% of accounts to be low customer risk score, 25*% medium-low customer risk score, 25*% to be medium customer risk score and 25*% to be high customer risk score. * Not actual numbers
- The monthly average Early Warning System score historically is within 2.5% tolerance of the mean Early Warning System score.
If any of these tests were to fail it would be categorized as a high priority and PagerDuty would send an alert to one of DataDuty’s on-call data scientists to investigate whether the model’s definition of “churn” was accurate and if it required an update.
Data Drift Tests
Over time, model features can become more relevant or less relevant to the Early Warning System model’s score and PagerDuty has developed tests to mitigate these risks. For example, last year one of the key metrics was the percentage of incidents that were “acknowledged“ (incident acknowledgment rate). This was a relevant feature for predicting an account’s likelihood of churn. However, recently it was found that the acknowledgment rate of high urgency incidents was more relevant and replaced the original incident acknowledgement rate. PagerDuty conducts the following tests to determine the relevance of a feature within our feature store:
- Cohen’s d estimates the effect size between two means. The Early Warning System model engine relies upon having features that have significant distance between means between customers distribution and churned customers distributions.
- Kurtosis measures the “tailedness” between two distributions. Customers and churned customers’ distributions’ tail should have a significant gap.
- Kolmogorov–Smirnov test is a nonparametric test of the equality of continuous, one-dimensional probability distributions that can be used to compare a sample with a reference probability distribution or to compare two samples. Early Warning System model compares the two distributions for customers and churned customers.
- T-Test is an inferential statistics used to determine if there is a significant difference between the means of two groups and how they are related. When all else fails, calculate significance for features.
Features should stay within the assigned thresholds or PagerDuty will create an incident and assign it to one of DataDuty’s on-call data scientists to investigate the discrepancy. In addition, these metrics are investigated quarterly to review if a new feature should be added within the Early Warning System model.
Upstream Data Drift
Upstream of the Early Warning System Model are the aggregated data tables that store relevant metrics for potential use. There are currently nine main aggregate tables that have to be monitored, as well as over fifty base tables that the aggregate tables draw from. To maintain data integrity and uptime, PagerDuty tech-stack includes: Snowflake to warehouse the data, Monte Carlo to maintain the data integrity, Apache Airflow to schedule jobs, Databricks to build and conduct experiments on the model, and PagerDuty to perform incident triage if any issues arise. For example, when a “bad load” of data affects the Early Warning System Model, PagerDuty creates an incident and notifies DataDuty’s on-call data engineer.
PagerDuty and Model Drift Example
The following is a real life example of a PagerDuty alert that one of the DataDuty team received when they were on call.
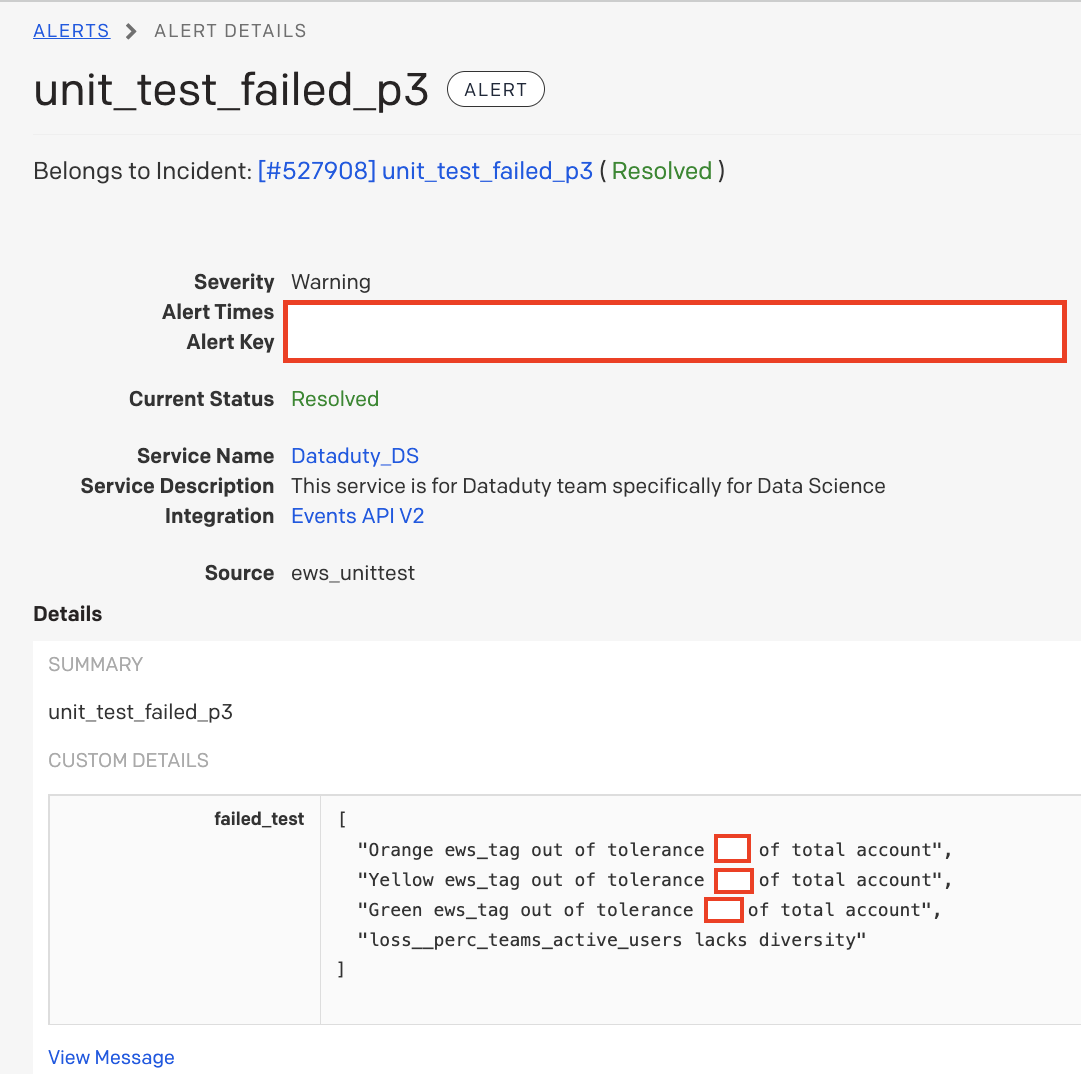
The data scientist was the first to receive an alert that there may be something wrong with the Early Warning System Model scores because these tests were designed to capture concept drift. The source of the incident was the “ews_unittest” source, which is where the model drift tests live. Next, the data scientist reviewed the failed_text and noticed that all of the customer risk score allocations were lower than their expected tolerances and one of the metrics did not have a lot of variation. The data scientist, from previous experience, deduces that the metric in the failed_text most likely “zeroed out” because the aggregate table did not update. After a few minutes of investigation they confirmed this was the root cause of the incident. They reassigned the incident to a data engineer and added a note to reload the aggregate table the problematic metric was coming from and to rerun the model calculations. Within thirty minutes, the model produced “all clear” signs and the correct scores were pushed into production before any of the Customer Success managers became aware of the problem. With the power of these automated tests and PagerDuty, the DataDuty team managed to diagnose and resolve the incident before affecting the operations of the organization with minimum interruption to DataDuty’s data engineer’s day-to-day and data scientist’s day-to-day.
When data science models become critical infrastructure to an organization where accuracy and uptime matters, data science teams should consider adding tests that monitor model drift and alert the appropriate stakeholders at the first signs of trouble. Building trust amongst data model practitioners is paramount to the success of business machine learning models. As Kevin Plank once said “Trust is built in drops and lost in buckets”, so don’t let model drift affect the trust of your models.