- PagerDuty /
- Blog /
- Automation /
- Debugging Kubernetes with Automated Runbooks & Ephemeral Containers
Blog
Debugging Kubernetes with Automated Runbooks & Ephemeral Containers
by Jake Cohen
May 2, 2023
| 5 min read
In our previous blog, we discussed the difficulty in capturing all relevant diagnostics during an incident before a “band-aid” fix is applied. The most common, concrete example of this is an application running in a container and the container is redeployed—perhaps to a prior version or the same version—simply to solve the immediate issue. For companies where every millisecond of performance and every second of uptime has consequential impacts on the customer experience, these types of short-term fixes are a necessity. The costs to the business become significant, though, when engineers are tasked with developing the long-term solution to these incidents. For both major and (recurring) minor incidents, engineers have to spend inordinate amounts of time gathering evidence of the state of the application and environment when the incident occurred.
While a good portion of this diagnostic data resides in monitoring tools and therefore persists, there are times when it is necessary to get a shell in a container to retrieve information that is only available for the lifetime of the container. In Kubernetes, this is done using the kubectl exec command. With the right parameters, users can get a live shell in their running container and start executing commands to retrieve diagnostics. For example, once a user has a shell in a Java container, they can invoke jstack to get a thread dump of their application.
But many operations teams do not let anyone exec into production pods (which is where critical incidents happen), or the number of people that can is very slim—for both security reasons and due to the limited number of people that are familiar with operating in Kubernetes. Consequently, in order to retrieve diagnostic data during an incident, individuals with Kubernetes access and expertise regularly need to be pulled in for help. This process drives up the cost of incidents by increasing MTTR, as well as the number of people that need to get involved.

For these reasons, it is best to use automation that removes the need for users to exec into running pods. With this automation architecture, when an issue occurs, an automated runbook is invoked, and that runbook retrieves the debug data, sends it to a persistent storage location (S3, Blob Storage, SFTP server, etc), and then informs the engineers where they can locate and use the debug data.
PagerDuty Process Automation provides a pre-built, templatized runbook for exactly this use case: when an alert creates an incident inside PagerDuty, this can automatically (or by the click of a button) trigger the runbook to execute commands in the pod, send the output to a persistent storage, and provide details on the location of that data in the incident.
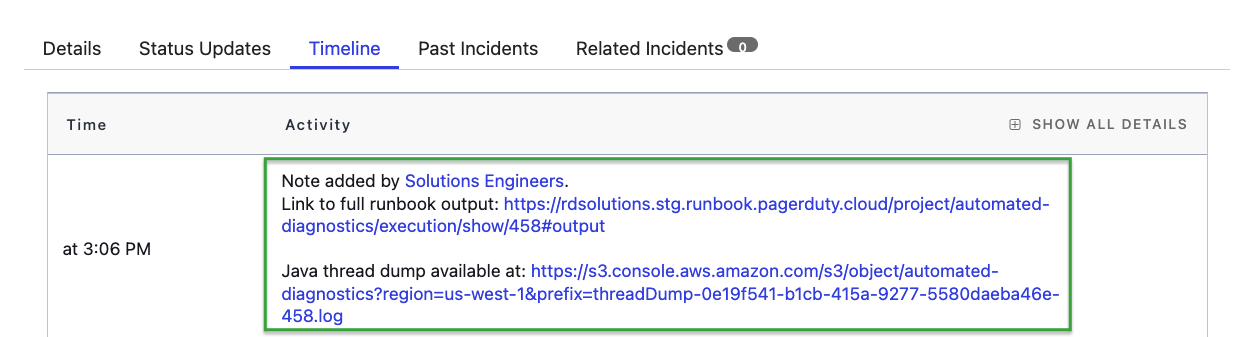
Link to debug data is provided to engineers during and after the incident
Users of both our commercial automation products (Process Automation and Runbook Automation) and open source Rundeck can follow the instructions here to download and get started with the automated-runbook.
This automated runbook is great when the container image already has the command-line utilities (binaries) needed for debugging. For example, many containerized Java apps ship with the jstack utility in the container image; however, what happens when the debugging utilities are not shipped as part of the container image? Or, as is increasingly commonplace, what happens when the container is “distro-less,” and therefore will not even provide a shell?
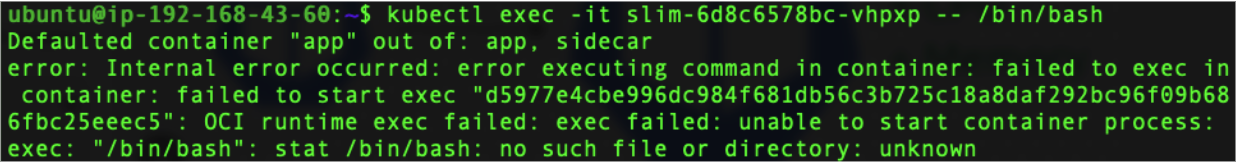
This is where Kubernetes Ephemeral Containers come into play—providing users a mechanism to attach a container (of any image) to a running pod without the need to modify the pod definition or redeploy the pod.
By sharing the process namespace, the ephemeral container can use its debugging utilities for another container in the pod—even if the original container is in a crashed state. Here is a blog by Ivan Velichko that goes into great detail about process-namespace sharing with ephemeral containers:
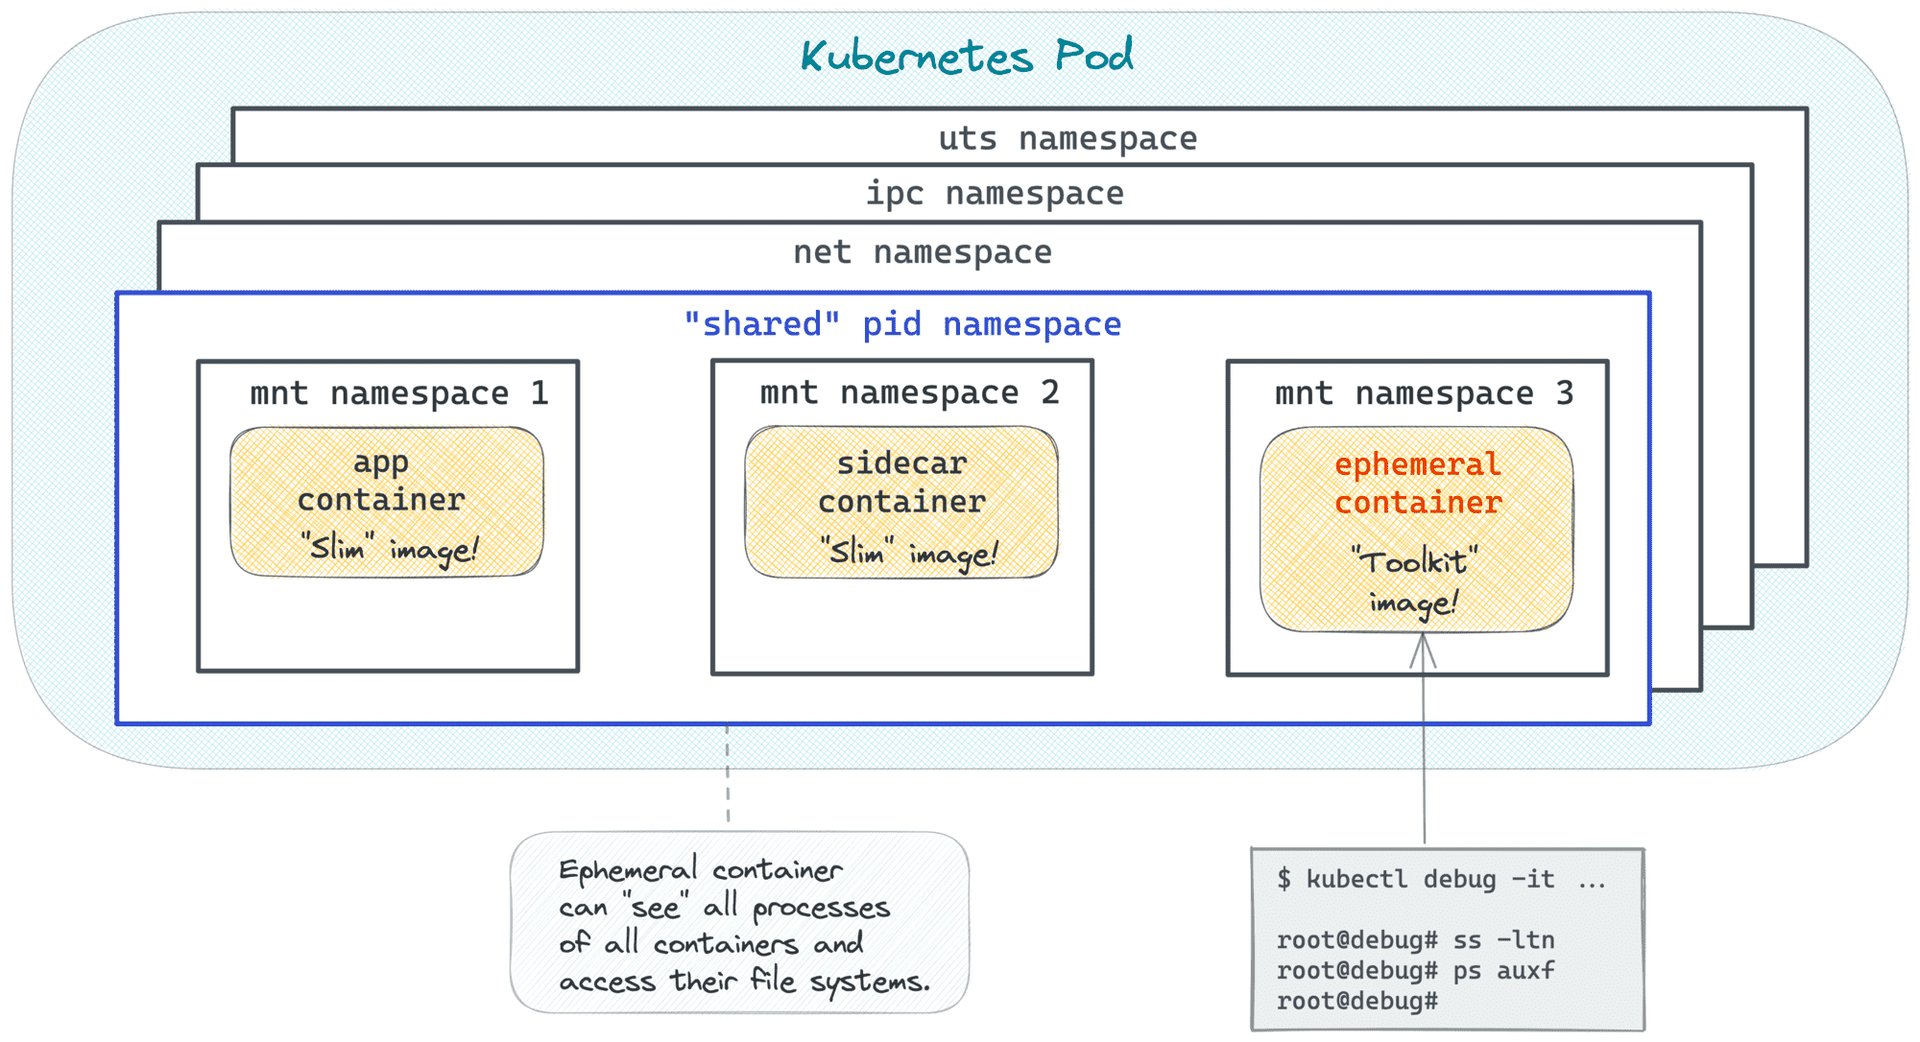
Source: https://iximiuz.com/en/posts/kubernetes-ephemeral-containers/
Similar to using kubectl exec, leveraging ephemeral containers properly still requires access to executing kubectl commands on the Kubernetes cluster—which is rarely available to those outside operations. And just as before, knowing how to properly construct the command takes a superior level of familiarity with Kubernetes:
kubectl debug -it -n ${namespace} -c debugger --image=busybox --share-processes ${pod_name}
(Sample command for using Kubernetes Ephemeral Containers)
To accommodate users that have containers without debugging utilities or distro-less containers, we have built a new Kubernetes plugin that harnesses the ephemeral containers functionality:
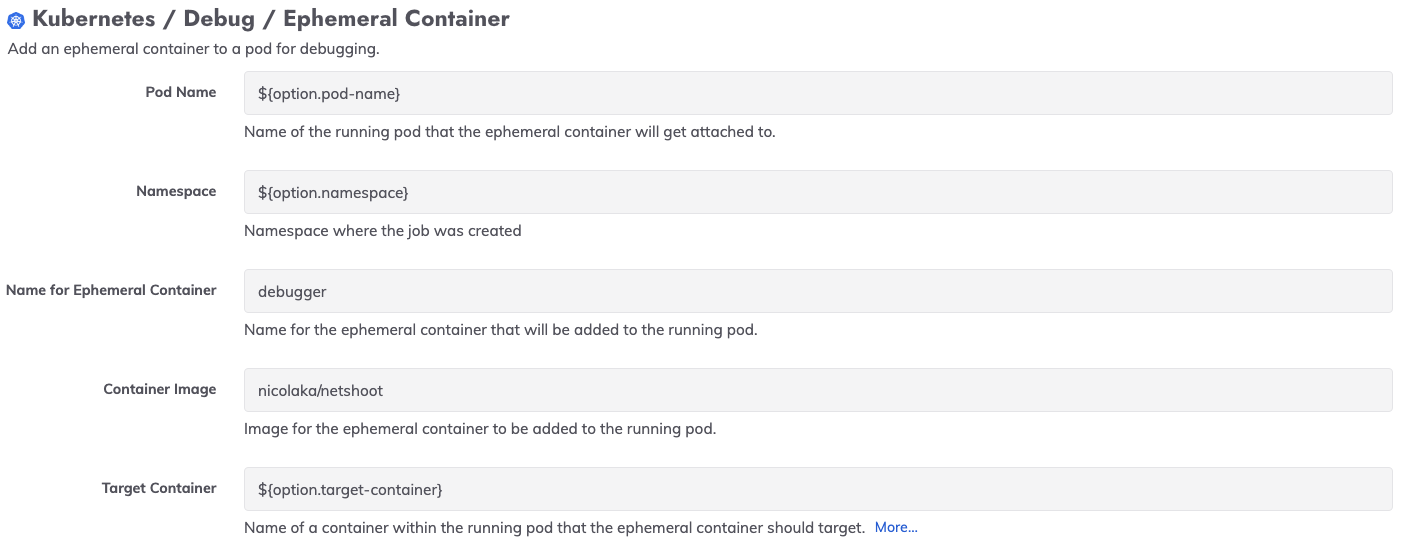
We have used this plugin in a template for an automated runbook that also captures diagnostic output and sends the output to a persistent location. Process Automation and Runbook Automation users can get started with this template job by downloading it as part of the Automated Diagnostics Project here.
If you do not yet have a Process Automation or Runbook Automation account, click here to get started with PagerDuty’s automation products.