- PagerDuty /
- Engineering Blog /
- When the Internet Blinked: How PagerDuty Stayed Resilient During the October 20 Outage
Engineering Blog
When the Internet Blinked: How PagerDuty Stayed Resilient During the October 20 Outage
by Rukmini Reddy
October 23, 2025
| 8 min read
On October 20, 2025, a significant outage in AWS’s US-EAST-1 region rippled across the internet, affecting some of the most widely used SaaS, messaging, conferencing, and cloud infrastructure providers. It was a reminder that the cloud, while robust, is not immune to failure, and when the core of the internet blinks, the effects are felt everywhere. Incidents are not an if; they are a when, and no organization is insulated, regardless of size, scale, or R&D investment.
At PagerDuty, we sit in a unique position: the last line of defense for operational awareness. When systems break, our platform ensures teams know what’s wrong and how to act. During this incident, our core incident notifications remained resilient, and our infrastructure and engineering teams took rapid, decisive action to mitigate downstream impact.
What Happened
Just before 3:00 a.m. ET, PagerDuty detected elevated notification failures, initially suspected to be internal auth-related issues. That was quickly ruled out. As the situation unfolded, it became clear that this was a major upstream provider event. Our internal “internet weather” dashboard suggested a broad impact due to a sudden, out-of-the-ordinary increase in notification traffic across multiple accounts. This has been a reliable signal for us to identify that a significant internet outage is ongoing before it shows up on any status pages. Still, it doesn’t tell us the underlying cause.

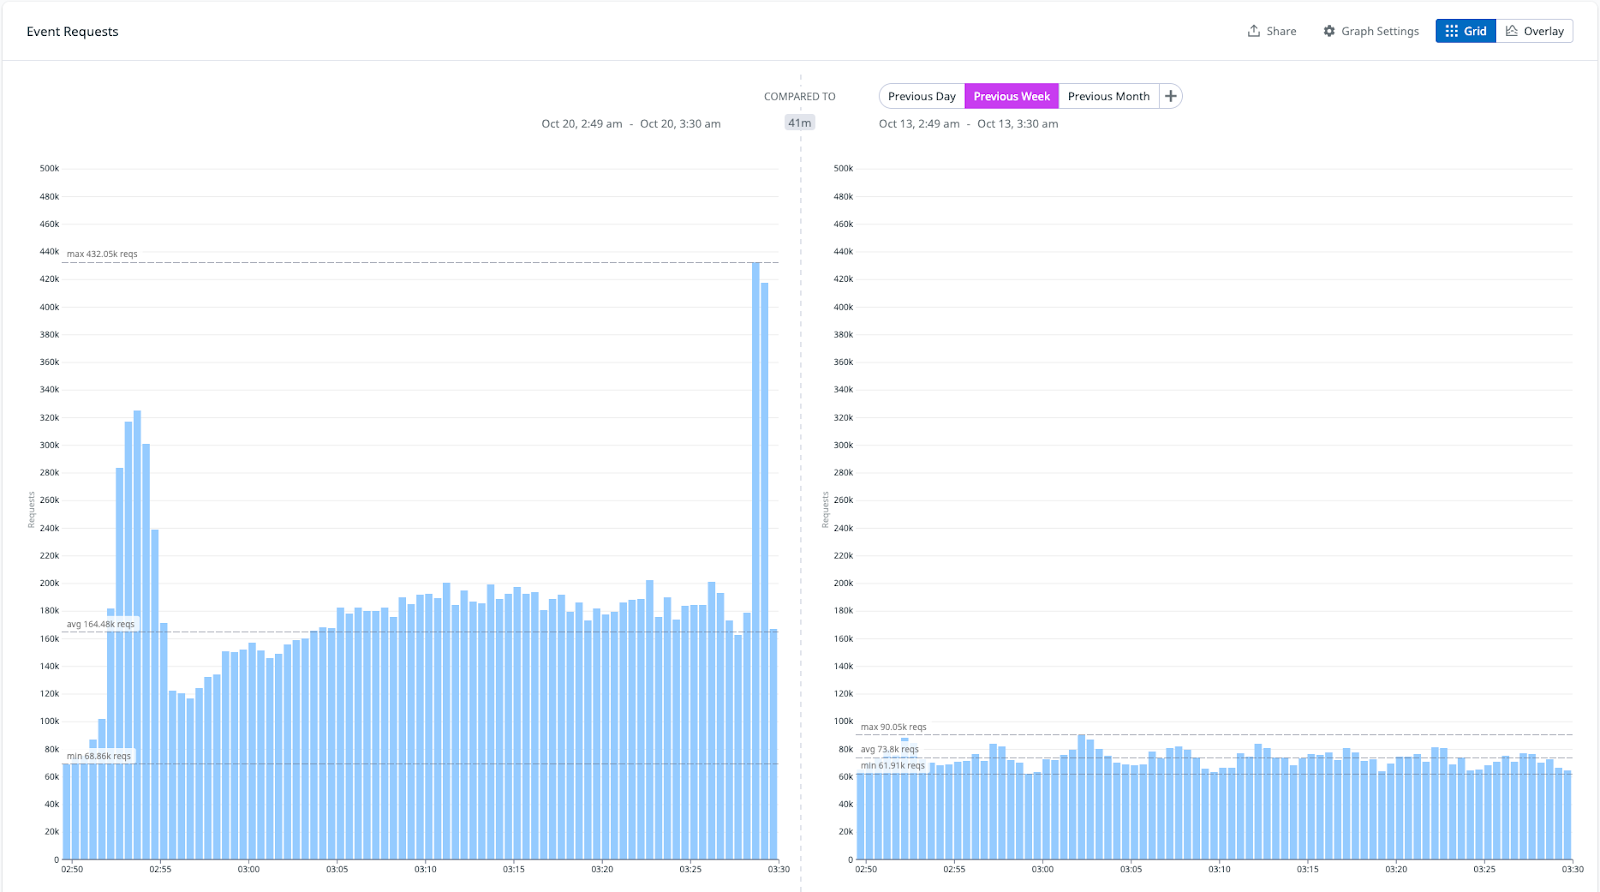
As the incident continued to unfold, we observed increased rates of events, incidents, and notifications. Our events and incident traffic typically remain at a stable baseline overnight, as this is generally a low-traffic period for most of North America. However, as shown in the graph below, our traffic spiked to at least three times the usual volume right at the beginning of the incident. From our end, the first signs of trouble began at 2:52 a.m. ET. This kind of increase is highly unusual unless a widespread issue is occurring. Below is a comparison of our traffic levels during the early stages of the incident with the same period the week prior.


Multiple third-party services, including messaging and conferencing platforms, began reporting degraded performance or full outages. It became evident that this centered around AWS US-EAST-1.
Our incident-path notifications (voice, SMS, mobile push), the lifeline for real-time operational response, remained stable. However, it required intervention to adjust routes in response to the incident’s external effects.
The most significant impacts we saw were concentrated on a couple of non-core PagerDuty services hosted in that region, most notably:
- Workflow Automation (formerly Catalytic, acquired in 2022) experienced UI and run failures.
- Advance Scribe Agent could not join conference calls.
By The Numbers
For the 12 hours when we saw the most impact, here are some stats from our platform.
- Events entering PagerDuty: 135,290,000
- Incidents created: 2,314,163
- Notifications sent: 3,430,000
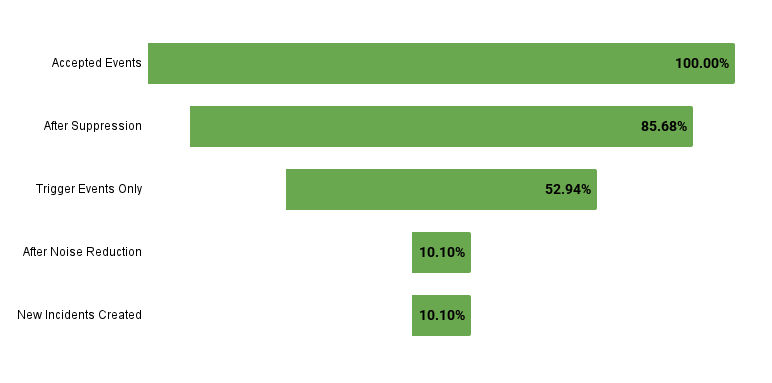
Our deduping and Event Intelligence Noise Reduction features really proved their worth by ensuring on-call teams weren’t just bombarded by an endless stream of pages.
What We Saw From the Frontlines
From our unique vantage point, we observed sharp changes in infrastructure and communication layer behavior that highlight the fragility of the internet during region-wide cloud outages:
- Provider Latency and Failure Spikes
Voice and SMS latency and retries spiked in the US and India as carrier routes degraded. We reweighted traffic across providers by geography to avoid the worst paths. - Chat and Conferencing Delays
Chat notifications experienced retries and out-of-order delivery. Conferencing integrations failed to initialize due to upstream provider outages. - Observability Degradation
Our cloud-hosted telemetry tools were impacted by the AWS issues, limiting visibility into metrics and events. We relied on internal (self-hosted) dashboards to maintain situational awareness. - Broad Impact across our Customers
At the onset of this incident, we saw a sudden increase across all key product dimensions.
How We Responded
Our incident response playbooks activated quickly:
- Internal Incident Management Processes
As the incident unfolded, we quickly coordinated on Slack and also prepared our alternative communication channels in case the situation worsened. Our Incident Commanders are trained in backup communication procedures, which are specifically designed for moments like this when even the services we rely on may be experiencing issues. Interestingly, our SRE Agent was among the first systems to alert us to this new and unusual pattern, observed only rarely over the past six months. This confirmed the data we were correlating with our “Internet Weather” dashboards. - Regular Status Page Updates
We posted regular updates to our status page in order to provide customers up-to-date information on how our product is performing so that they can respond accordingly. While doing so, we make a point of avoiding any mention of or passing the blame to any third party. We decide which third parties we use and whether we rely on them as hard dependencies. We own the impact of our product experience to our customers when these degrade. - Instituted a Change Freeze
With key observability vendors degraded, including some third-party monitoring and metrics platforms, we immediately froze deploy pipelines to reduce risk. When visibility drops, even small changes can magnify uncertainty. The goal was simple: preserve stability until we could fully trust our telemetry again. - Reweighted Notification Routes
Our notification system is configured to use multiple providers and retry delivery across them. These are optimized for redundancy and deliverability on a per-destination-region basis. During this incident, we dynamically rerouted traffic away from impaired providers, particularly in the US and India, to stabilize notification delivery. - Maintained Incident Path Stability
We prioritized the stability of core alerting, ensuring that event ingestion, incident creation, escalations, and on-call notifications remained operational.
Where We Held Strong, and Where We’re Investing
What Worked
- Prior investments and experience dealing with this scale of incident meant we had the necessary capacity and redundancy in place to handle the increased load despite downstream degradation.
- Country-level routing playbooks enabled rapid mitigation.
- Clear separation of incident-path vs stakeholder notifications helped focus our response.
- Multi-source observability enabled continued decision-making even with degraded tools.
What We’re Improving
- Reducing regional dependency: Workflow Automation’s concentration in US-EAST-1 limited failover options.
- Resilient observability: We’re continuing our investments in fallback dashboards and telemetry pipelines to minimize blind spots.
- And more: An internal incident review is ongoing, which will identify additional investments to make us even more resilient in the event of a similar incident.
Lessons for the Industry
This incident underscores an important truth: the internet is a shared dependency, and no provider, region, or service operates in isolation. When a core region like US-EAST-1 stumbles, the ripple effects spread across every layer of the digital stack: monitoring, messaging, compute, and beyond.
What matters most is not avoiding failure, but responding quickly and effectively. At PagerDuty, our resilience strategy is designed to protect the most critical workflows, even when the broader ecosystem is unstable.
But there’s a more profound lesson here about accountability.
As engineering leaders, we all make deliberate architecture and dependency decisions. Those decisions come with ownership. When an upstream dependency falters, the right question isn’t “who failed?”, it’s “how did we design this?” And just as importantly, “what will we do differently next time ?”
Separate Observability from Response
Outages test the entire chain of trust. When cloud-hosted observability tools degraded, we relied on self-hosted telemetry in another region and froze deployments/system changes until visibility was restored.
It reinforced our principle that the systems you use to observe should never depend on the systems you use to operate. We call this the “church-and-state” model — maintaining clear independence between observability and incident response to ensure responders can still act with confidence, even when dashboards go dark.
Lead with Values, Not Velocity
Technology can fail; leadership can’t. During this event, our approach reflected the same principles we have followed for over a decade that define how we build and how we lead:
- Ack + Own. We make intentional design and dependency decisions, and when things break, our focus isn’t on blame; it’s on learning. Ownership means understanding how our choices shaped the outcome and improving from there.
- Communicate early, even when imperfect. Transparency builds trust faster than certainty.
- Pause before you push. Freezing deploys when observability was degraded wasn’t hesitation, it was discipline.
- Build systems, not heroes. Resilience is the product of preparation and culture, not adrenaline.
Show compassion for the humans involved. Outages are stressful for everyone. It’s tempting to criticize when others stumble, but our interconnected systems remind us that empathy and humility are part of reliability. #hugops