- PagerDuty /
- Blog /
- Automation /
- Calculating Business Value of Automation in PagerDuty Process Automation
Blog
Calculating Business Value of Automation in PagerDuty Process Automation
by Greg Chase
March 1, 2023
| 5 min read
Budgets in IT departments are tight these days, so proving a return on investment is essential for justifying or expanding a project. The good news is that automation saves money by reducing the amount of human effort required. It is similar to investing in a robot vacuum cleaner. Despite the upfront cost, you save time (and money) by not having humans do the vacuuming.
Reporting the value delivered by an automation program can be challenging since the value depends heavily on what is being automated. Your project proposal may forecast time and cost savings by automating certain manual tasks. Tracking and reporting those savings is how you show the business impact of your projects. So how can you simplify tracking and reporting?
We have a feature in PagerDuty Process Automation that can help: the ROI Metric Data plugin. The ROI Metric Data plugin follows the simple principle that every time an automation runs, it delivers value. The automation developer specifies value metrics by defining key values such as hours-saved:10 for their automation.
Whenever the job executes, these metric values are added to the log entry of the execution. The plugin also provides an end point to extract the JSON records of these runs, along with other metadata about the executions—making it possible to compile, calculate, and analyze these metrics over time.
Here are some patterns you can follow to track the business value delivered by your automation projects.
Reporting savings from reduced labor costs
The most direct benefit of automating a task is the cost savings of the labor it replaces. Take this use case shared by Robert Powers from Brinks at PagerDuty Summit 2022. Their as-is process was a recurring data transfer job that took a staff member 5 to 10 hours to complete manually.
By automating the process with PagerDuty Process Automation, they turned this process from being ¼ of one person’s job every week into an automated task that takes zero human time.
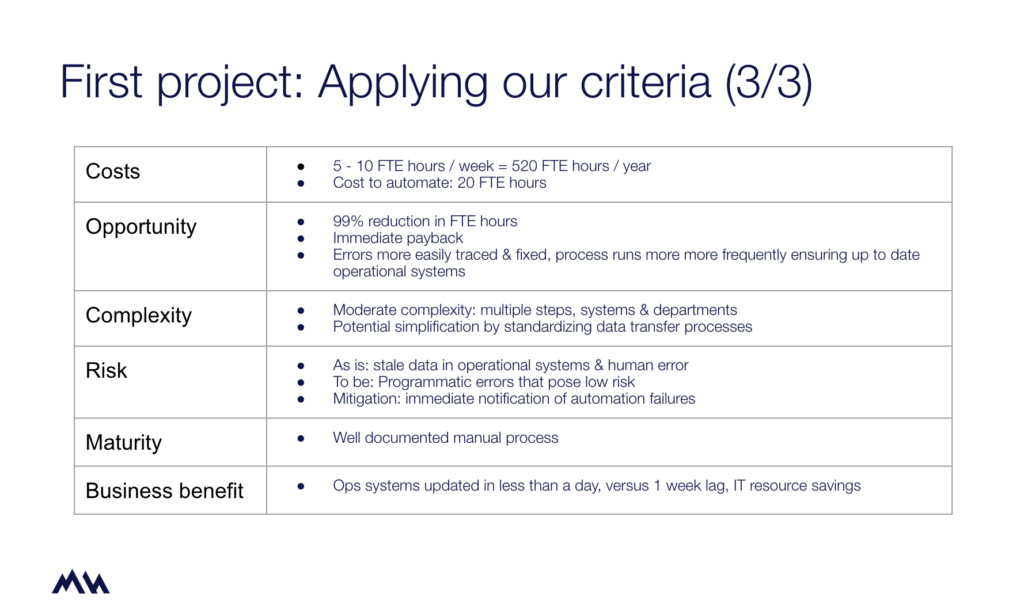
Cost, opportunity and benefit criteria of a data transfer automation project
To use the ROI Metric Data Plugin to track the value generated in this scenario, you would simply define a metric hours_saved with a value of 10 to include this metric in the execution records of this process. This will give you an easy metric to be able to export to show total hours saved per execution of this process. We chose this arbitrary key-value approach since these values can change over time as you add capabilities to your automated job. This way, you can compare the value of newer versions of your automation to older versions when charting data—provided you don’t change the key names.
For your own scenario, you will want to determine how much time is spent by workers manually completing tasks that you will be automating. This can be as accurate as you want the end result to be. Estimates are OK, or you can develop an average time spent through observations. The average or estimate will be the value you pair with a key such as hours_saved. You can break these out by employee job type if you want to track costs savings, or changes in workload distribution. Simply define more key-value pairs: DBA_hours_saved, senior_engineer_hours_saved. If you want to calculate a return on investment, you’ll also want to keep track of the hours needed to create the automations. You can also define values in monetary value, or convert hours to monetary value during your analysis.
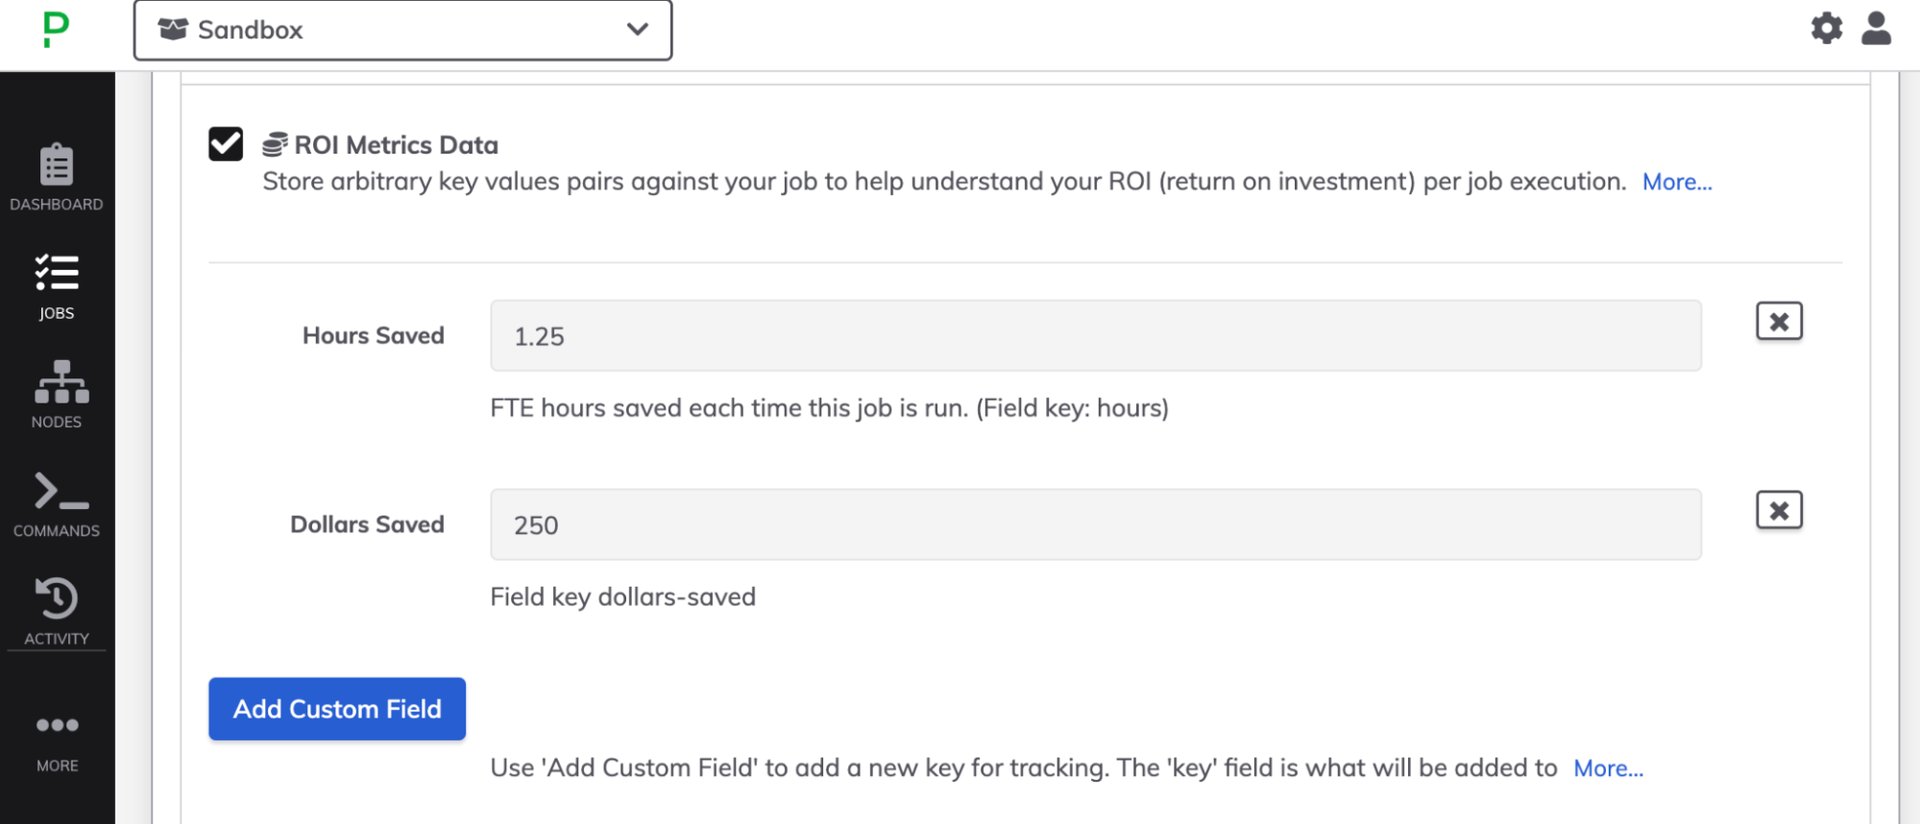
Here we have created two key-value pairs to be logged per job run: Hours_Saved : 1.25, and Dollars_Saved : 250.
Upload the job execution data to your favorite reporting tool, such as Tableau. You can chart the compilation of your different metrics by user, and job over time. For example, you can show hours saved from manual executions by users vs. scheduled job runs. You can calculate money saved either directly from metrics you have defined, or by converting different hours metrics to costs.
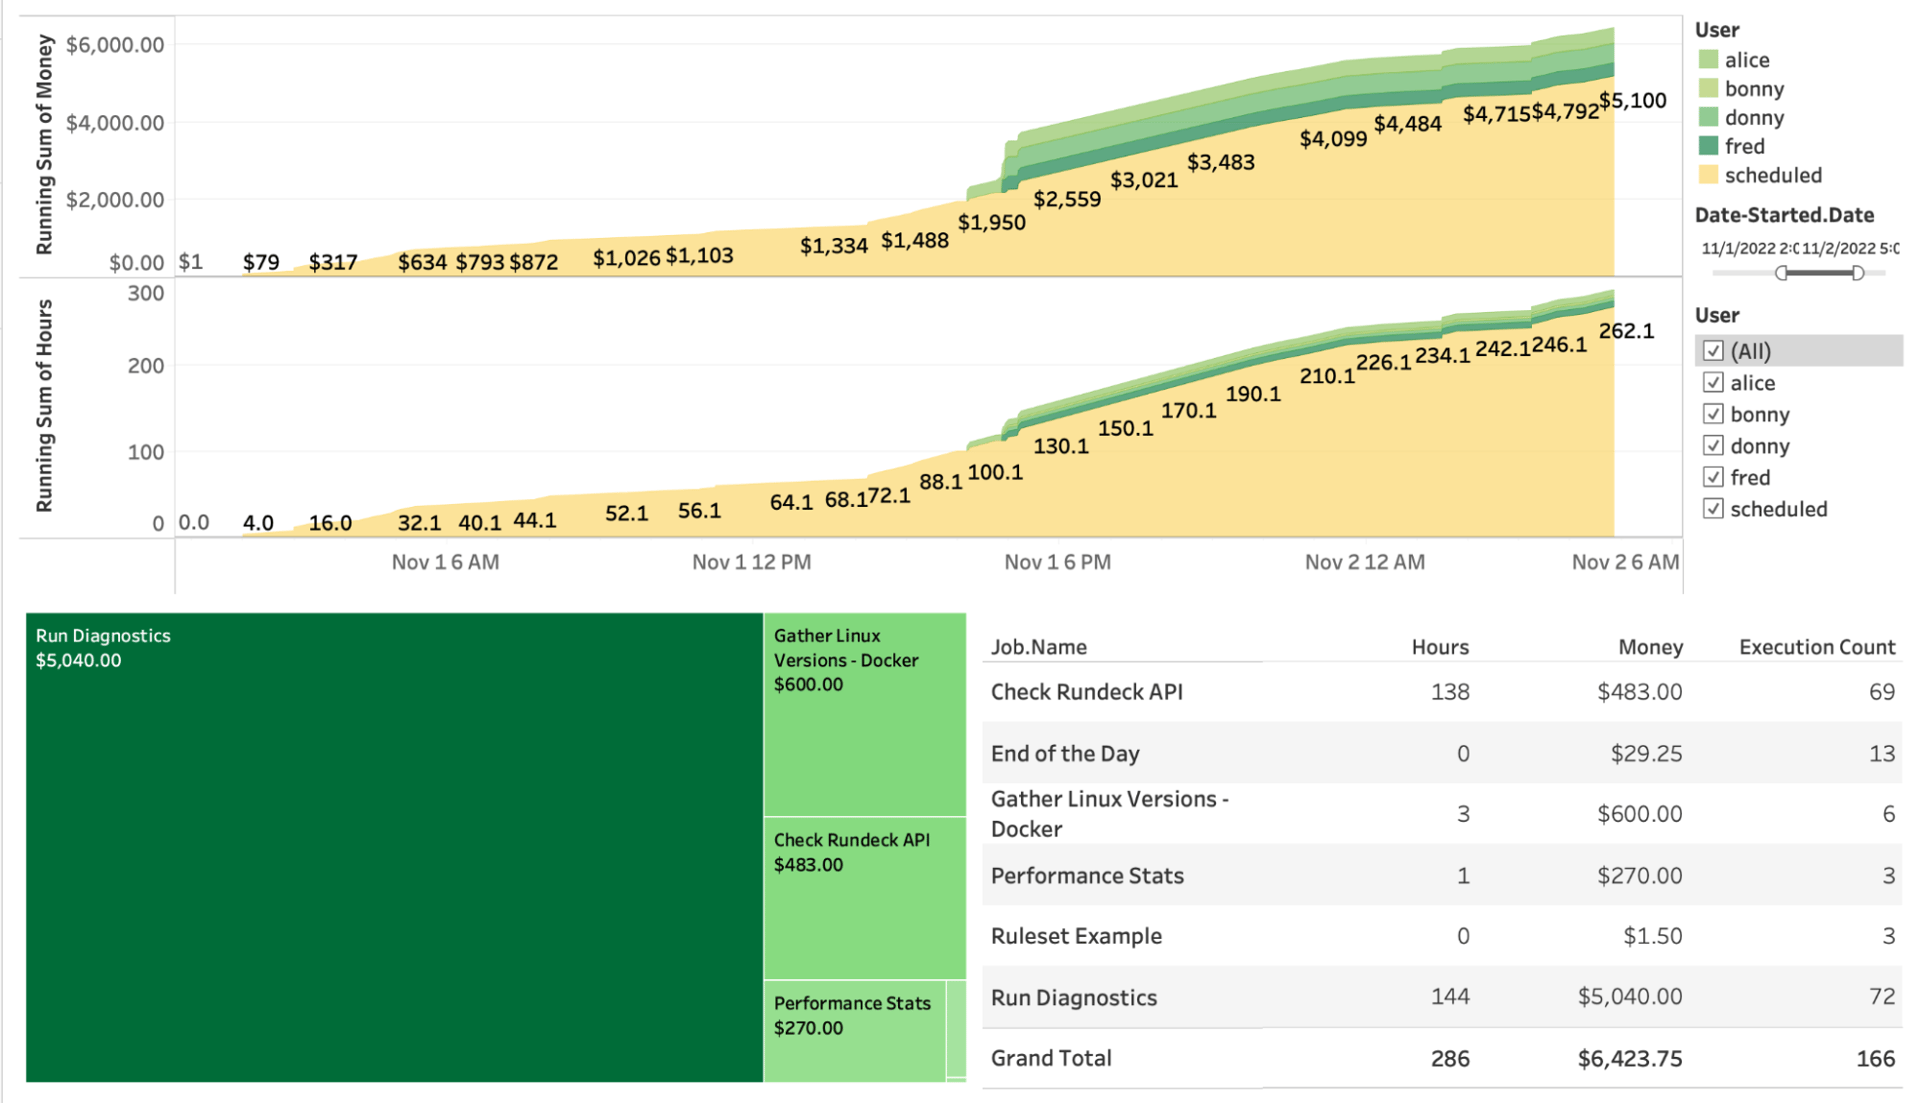
Here is an example of charting the logged data showing increasing money and time savings from scheduled job runs and user-invoked job runs.
Converting these metrics to return on investment requires adding the costs associated with the implementation of automation. In the customer scenario we shared above, 20 FTE hours (assuming equivalent labor costs) was the cost to create the automated process. If this includes maintenance over a year, this looks like: 520 FTE Hours Saved – 20 FTE Hours to automate = 500 hours saved in just the first year of operation.
Adjusting metrics by automation outcome
Following the principle that automation delivers value whenever that automation runs, we may wish to calculate value according to the outcome of these runs. This would mean filtering out automation runs that are unsuccessful.
There are different reasons why an automation execution may be unsuccessful. There may be problems with the job definition itself, or errors reported by nodes and workflow steps that don’t otherwise terminate the job. In the case of one of these unsuccessful executions, you may wish to filter them out of your value calculation.
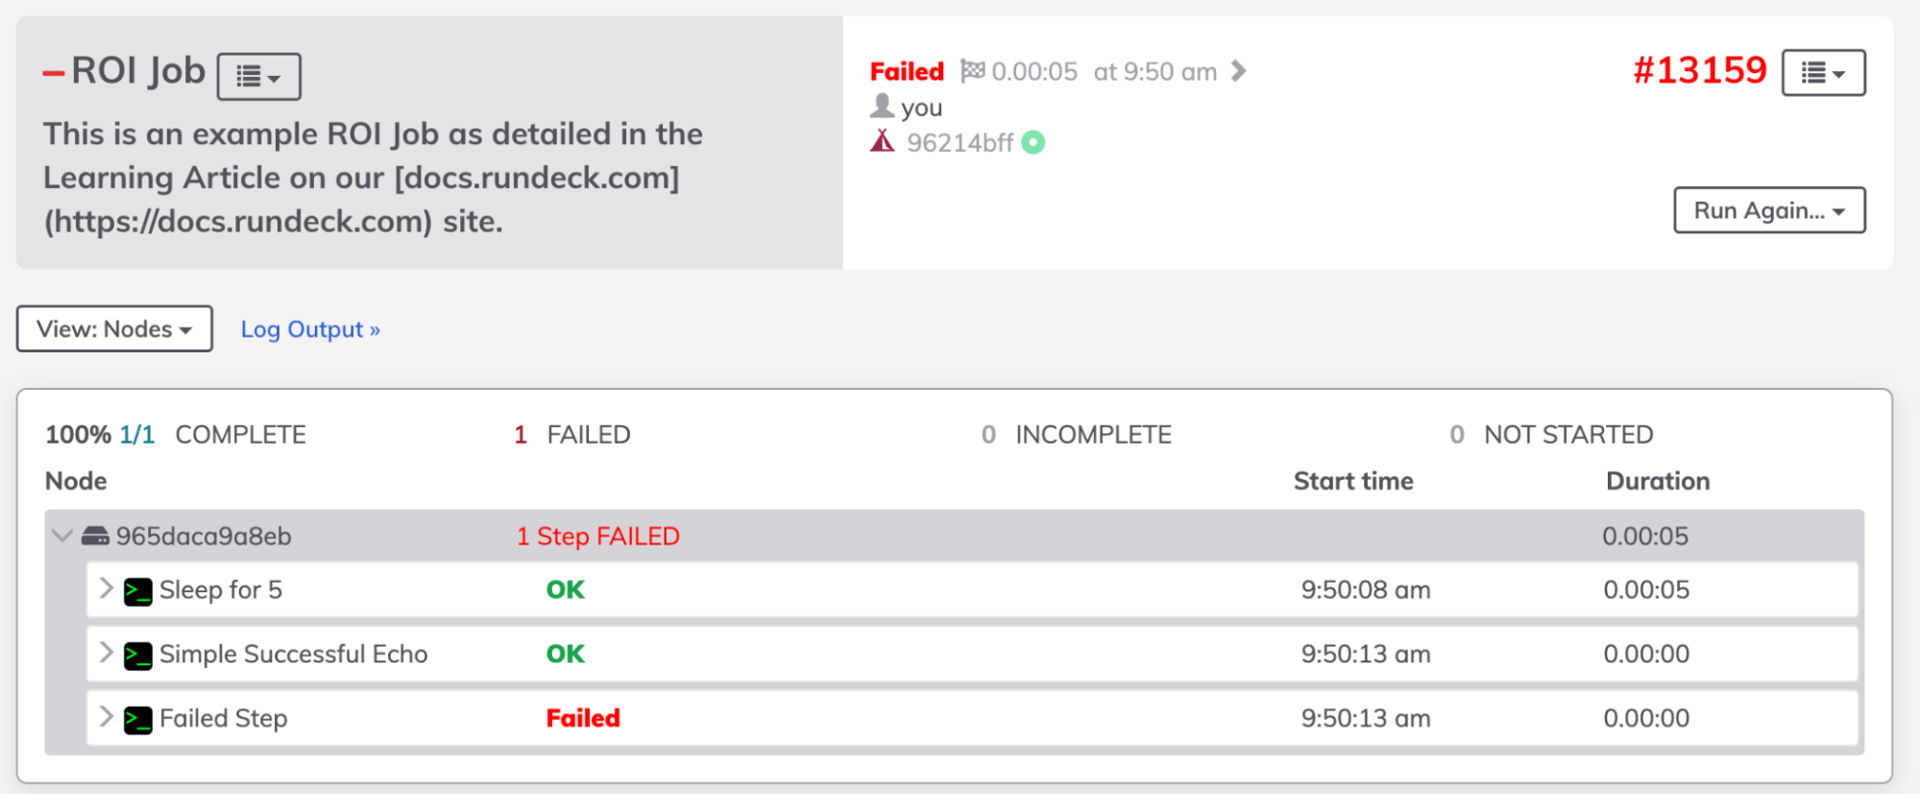
Example job run with a failed step
When running analytics we can choose to filter out unsuccessful runs due to external failures from integrated systems.
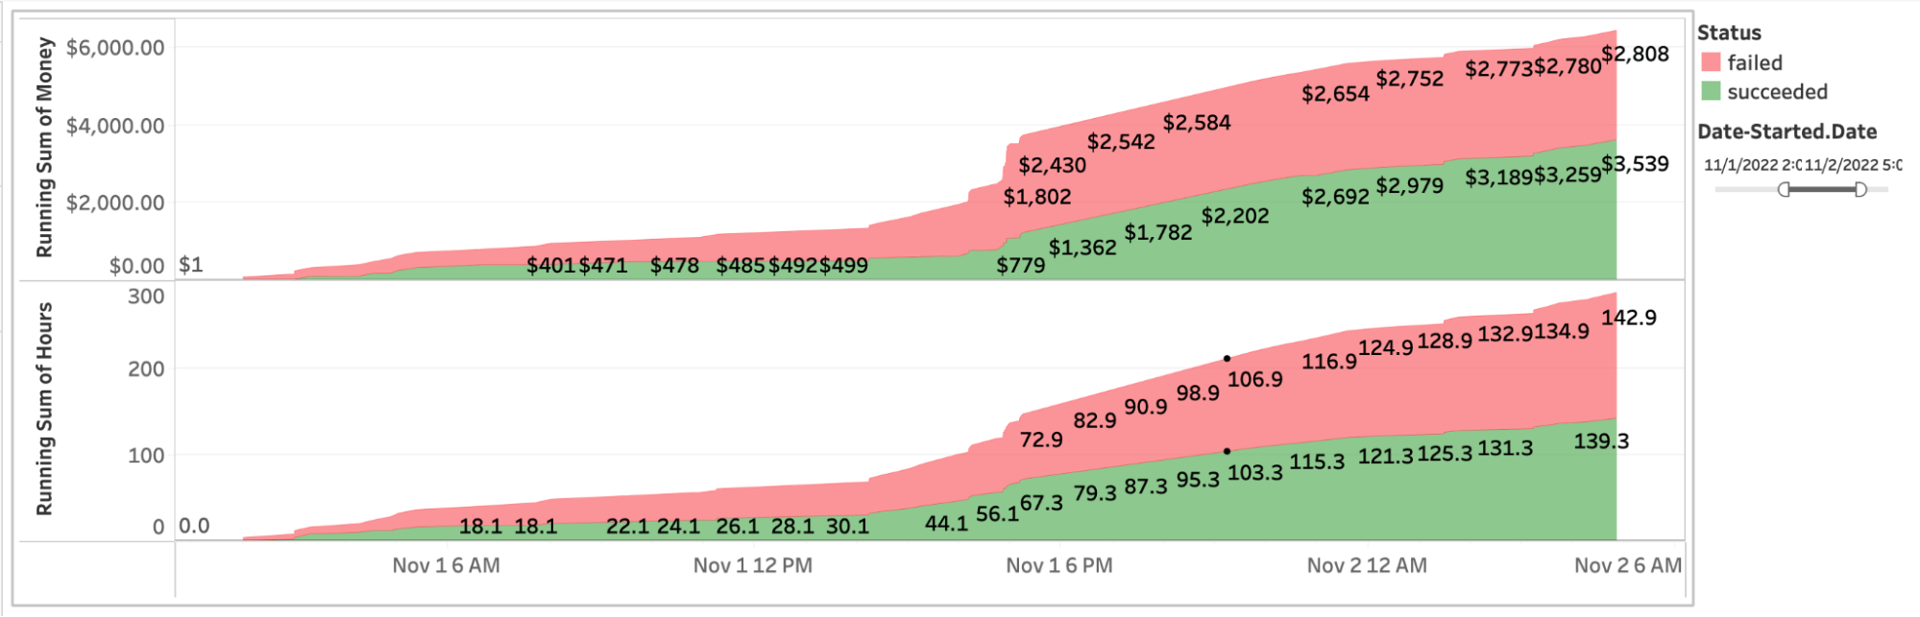
Example chart showing hours and money saved and job status
The ROI Metric Data Plugin is available in PagerDuty Process Automation as of Version 4.7, and is also available as part of PagerDuty Runbook Automation. To learn more about working with the ROI Metric Data Plugin, check out the Process Automation Documentation.
If you are not already a user of PagerDuty Process Automation or PagerDuty Runbook Automation, schedule a demonstration or trial today!