Stay Ahead of Outages With Proactive Incident Response
by Ariel Russo
June 18, 2020
| 5 min read
How would your daily life be impacted if you had a bird’s-eye view of your operations, their dependencies, and the ability to spot indicators that an incident or outage was likely to happen? What would it mean for your business if you were given minutes or hours to get ahead of disruptions instead of reacting to a surprise? For most organizations, enabling proactive incident response translates directly to dollars saved, brand reputation protected, and less burnout within response teams.
Being proactive means giving both technical and business staff the necessary tools to orient themselves around their digital services so that if problems do occur, they’re not starting from a state of ignorance. In a digital world where seconds matter, on-call responders can’t be learning about infrastructure or response procedures on-the-fly. That’s why digital readiness, or preparedness, is so important.
And while it may have seemed like a distant dream to some, proactive incident management isn’t just a fairytale anymore. With PagerDuty’s latest enhancements from the Spring 2020 product launch, you can get a complete view of your digital services across all teams, their dependencies, and the relevant operational metrics needed to provide hypercare and prevent issues before they become revenue-impacting crises. Let’s explore how PagerDuty makes it possible.
Innovation Deep Dive
Service Profiles Within Dynamic Service Directory
Last fall, we introduced the Dynamic Service Directory as a way to track and manage all of your services in one convenient location. We built this directory because the growing complexity and rate of change within IT technology stacks means that the old ways of working—i.e., centralized, manual approaches to keeping track of components—just don’t scale in a cloud-native world.
Instead of slow and manual approaches that involve discovery and mapping by a separate team, PagerDuty’s Dynamic Service Directory presents service information captured through regular use of the platform. The directory not only has rich APIs that allow for automation, but it is also team-based rather than centralized.
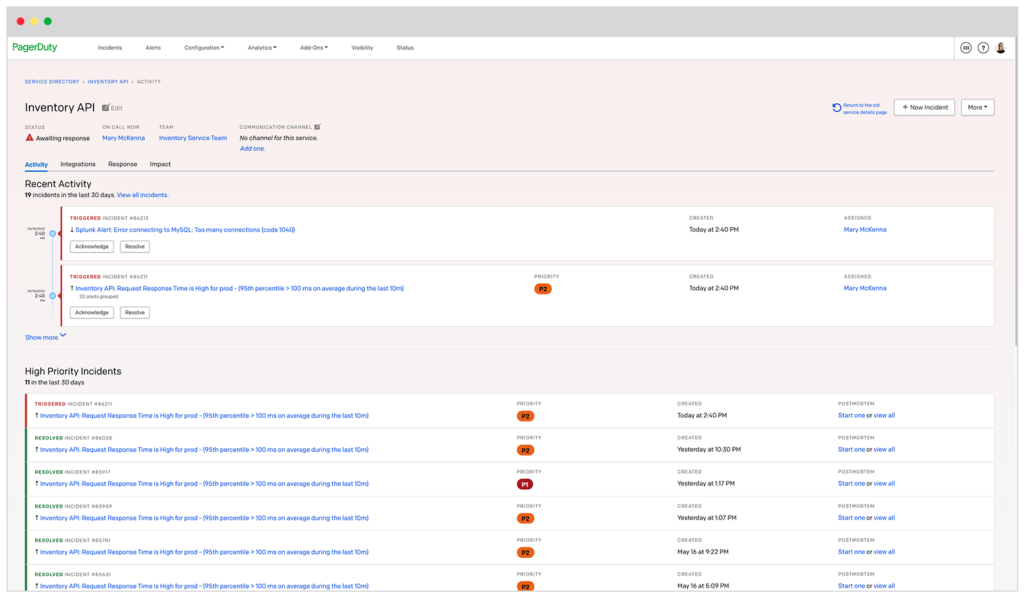
To enhance the amount of information available to responders, we have released new enhancements to our Dynamic Service Directory that we call Service Profiles. Service Profiles bring more meaning and context to services by creating an information architecture around each one. Now engineering managers and on-call responders can see useful information for each service like team ownership, who is on-call, past alerts and incidents, dependent services, runbooks, and preferred communication channels.
Service Dependencies
As organizations scale, it can become difficult to unravel complex, cross-cutting major incidents or understand how infrastructure is connected, leading to potential vulnerabilities. And despite a team’s best efforts, manually maintained wikis and static CMDBs all have limited, if not out of date, perspectives on the state of dependencies.
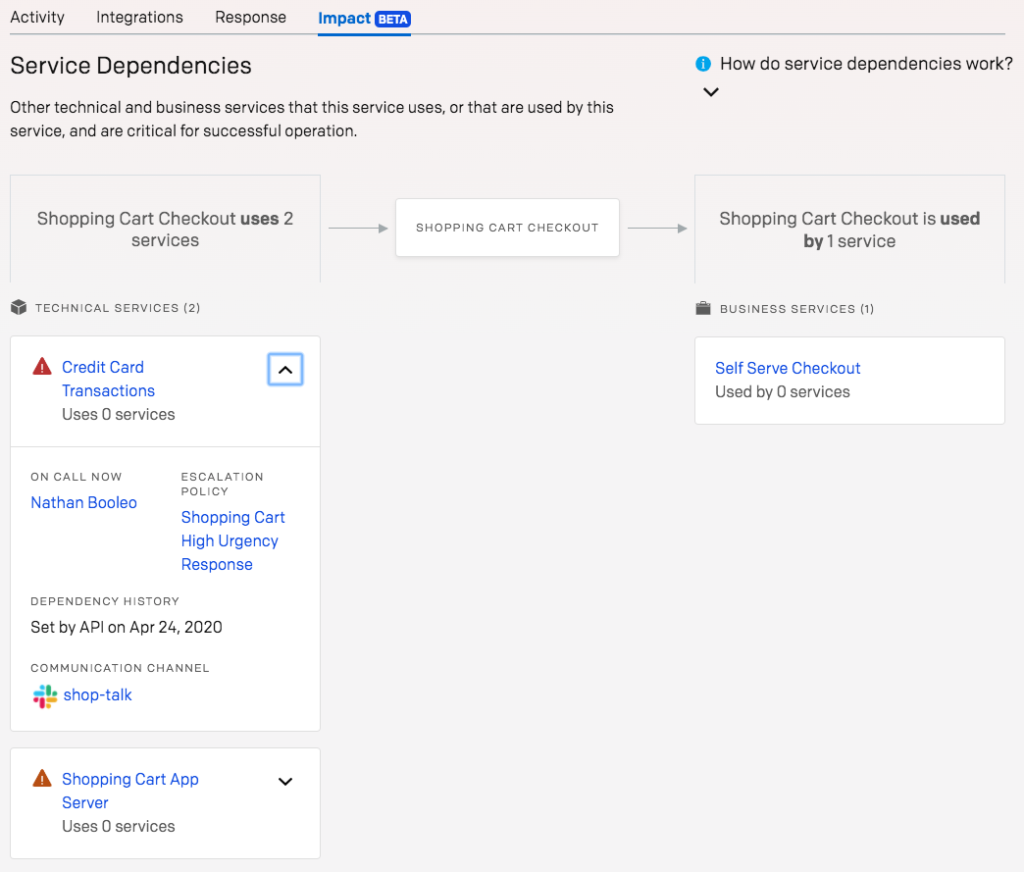
That’s why we introduced Service Dependencies in PagerDuty, now available for early access. Service Dependencies allow you to understand the relationship between services in order to identify, triage, and remediate issues faster. Users can navigate multiple services and levels of dependencies via an intuitive user interface to expose key information like who changed a service and when. Service Dependencies can drive powerful response automation, provide valuable peacetime insights about vulnerabilities, and match the mental model that organizations have of their own infrastructure.
Services Dashboard
In traditional IT organizations, it’s not uncommon for engineering teams to be unaware or uncertain of how incidents impact the services they provide. Without this understanding, they cannot proactively manage expectations from business stakeholders or focus their team on improving the right things.
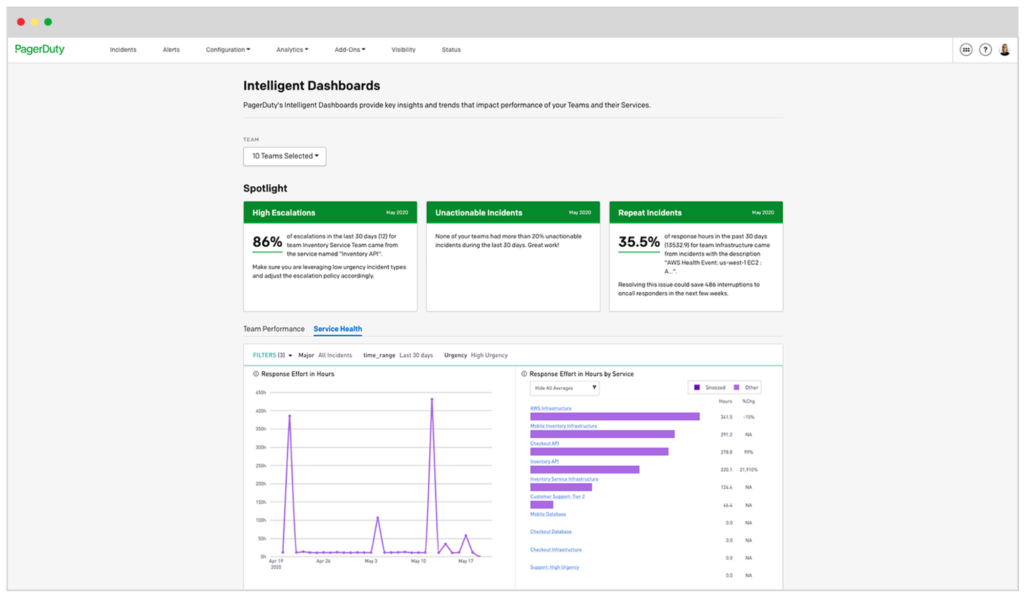
To help engineering teams overcome this problem, our new Services Dashboard provides a visualization of operational metrics and KPIs, leading to better cross-functional alignment and business outcomes. With this centralized view, the builders and operators of services can work together to more effectively manage product availability, resource allocation, and drive continuous improvement of teams and services.
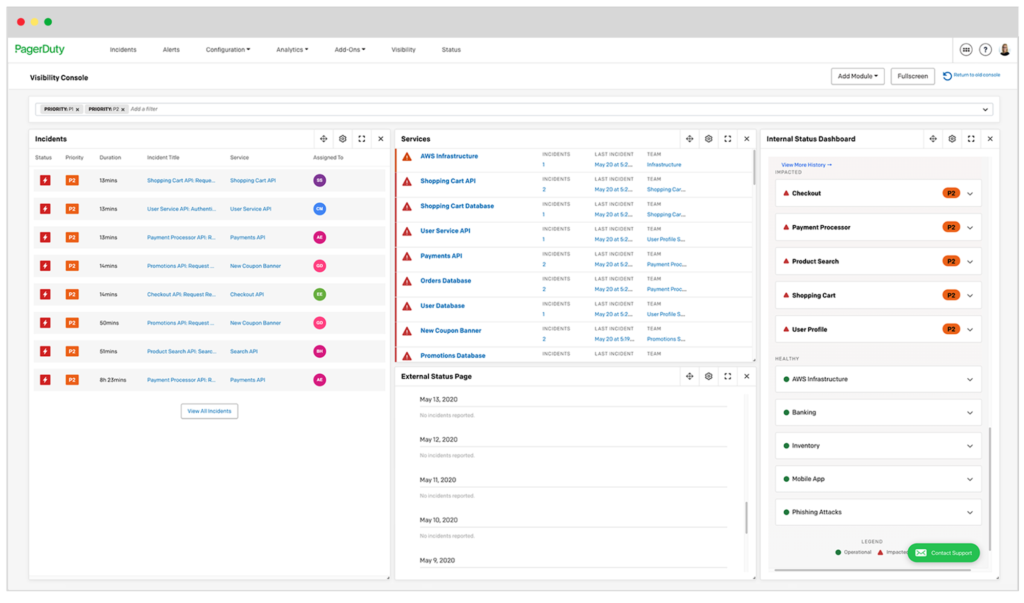
New Visibility Console Experience
In the current environment, we have observed the need for many customers to migrate physical, eyes-on-glass workflows from an actual network operations center (NOC) to a virtual environment, with NOC operators working from home. However, these operators still need a consolidated view of service performance.
PagerDuty’s Visibility Console, now available for early access, gives users a real-time view of digital operations. The revamped and adapted experience also includes advanced filtering and customizable layouts. This powerful console not only promotes operational readiness; it can also help bridge the gap between NOC and application teams in Hybrid Ops organizations. Most importantly, this tool enables teams to take a proactive approach to incident response, providing the context required to meet customer needs during moments of hypercare.
Enacting proactive incident response requires your team to have the workflow, automation, and information about the services you are managing so that they are prepared to deal with incidents when they happen. In our current economic environment, organizations should not underestimate the impact this approach can have when it comes to reducing costs, protecting customer relationships, and ensuring company resilience.
These new features are a small sample of the many ways your team can use PagerDuty to achieve proactive incident response. If your organization could benefit from any of these tools, be sure to check out our free trial or reach out to your account manager to set up a personalized demo.