- PagerDuty /
- Blog /
- Automation /
- What is Automated Diagnostics and Why Should You Care?
Blog
What is Automated Diagnostics and Why Should You Care?
by Joseph Mandros
June 3, 2022
| 6 min read
How do you measure the cost of an incident?
A lot of people in technology talk about the cost of an incident solely from the perspective of downtime, or the number of customers and employees impacted. And from the surface, oftentimes that is a fair angle to take. It makes the headlines, and customer reputation and trust are critical to the success of any business—obviously.
But another direct cost of incidents that is infrequently acknowledged is the number of people that need to get involved during an incident; whether that’s to help investigate the root-cause, troubleshoot and resolve the incident, or absolve their team of responsibility—regardless of whether the incident is severe enough to impact your customers.
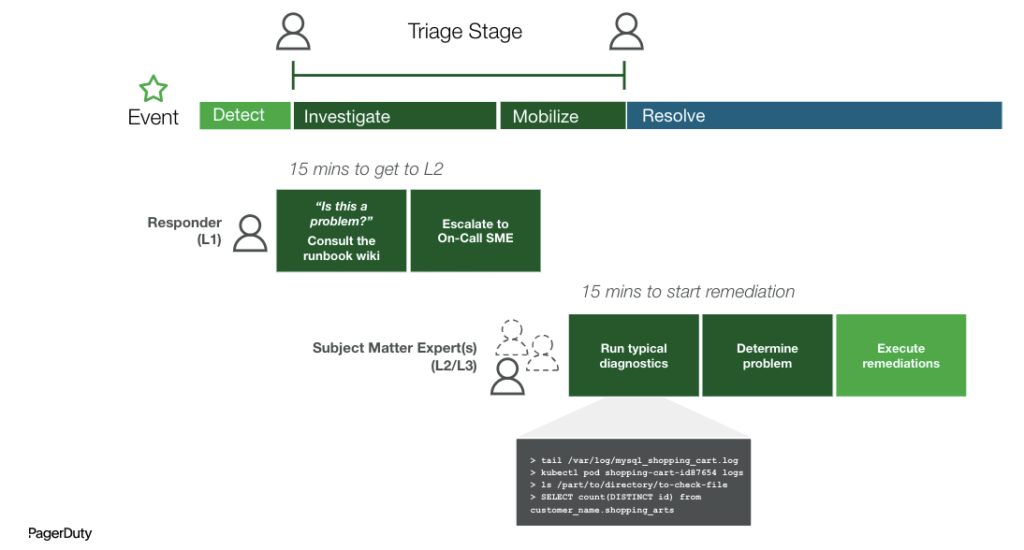
According to PagerDuty data, 50% of a responder’s time is spent determining who is best to pull in for additional support (and trying to figure out if there’s actually a problem) in x environment, or with y service. Given this statistic, this means that 50% of an incident’s lifespan is spent on the beginning stages of an incident (the diagnostic and triage phases), rather than on actual remediative actions.
The bottom line? The cost of people-hours and the number of manual actions taken per incident can get steep—fast.
Automating Your Incident Response
Applying automation to the early, recurring stages of the incident, including diagnosing the severity of the incident and understanding the genetic makeup of what went awry (and how), is critical to the success of the eventual remediation of the incident.
Automation is also important from a people perspective, ensuring your teams aren’t getting burnt out by the same, repetitive actions every time an incident kicks off. Ensuring the diagnostic data is available to first responders is paramount to the routing efficiency and overall workflow of the incident response.
Before we go any further, let’s first define diagnostic data. Diagnostic data is data retrieved by incident responders that is typically more specific than the information provided by monitoring tools. For example, whereas monitoring tools will alert you when there is a spike in CPU or Memory, the incident responders investigate by looking at the highest CPU and Memory consuming processes. Therefore, in this case, the Process Names or ID’s and their associated compute-consumption is the “diagnostic data.”
So now that we have defined Automated Diagnostics, why should you care? Because implementing an Automated Diagnostics practice can drive down the cost of incidents through both reduced incident duration and fewer responders paged.
The Problem with MTTR
Perhaps “problem” is the wrong word here, but hear me out: MTTR as a metric is too broad to return granular, actionable insights. Mean time to repair (MTTR) has been a staple maintainability metric in the IT universe for decades. And while it has many applications and does a great job of explicating the rate of general recovery, its achilles heel is just that—generality. And now that we can safely infer that 50% of a responder’s time is spent determining who is best to pull in for additional support, we’ve started looking at other metrics within the MTTR timeline, such as MTTT (mean time to triage) or MTTI (mean time to investigate).
MTTI/MTTT: The average time between the detection of an IT incident and when the organization begins to investigate its cause and solution. This denotes the time between MTTD (mean time to detect) and the start of MTTR (mean time to repair).
At PagerDuty, we measure this as the time span between when your first responder “acks” to when your resolver “acks.” This metric helps us click into what’s actually happening under the hood during an incident. After observing our own data, we’ve been able to infer that MTTI is one of the most time-consuming factors of MTTR. And in modern business, when a task requires time and attention from engineers, then that task is an expensive one for the business. Really expensive.
Using Automated Diagnostics
Now let’s bring this back around to MTTI and automated diagnostics. MTTI is not only lengthened by the technical tasks of responders manually pulling diagnostic data and having to decipher which team to escalate to based on x service and y incident. It’s also about the people and their limitations, depending on the specific expertise that is required to begin resolution. For example, in many cases, the first responder doesn’t know how to investigate the issue from the database or network ‘perspectives.’ That may be due to their lack of skills (background in databases or networks); access, or tribal knowledge (e.g. that a specific app-component depends on a complex integration with a third-party service).
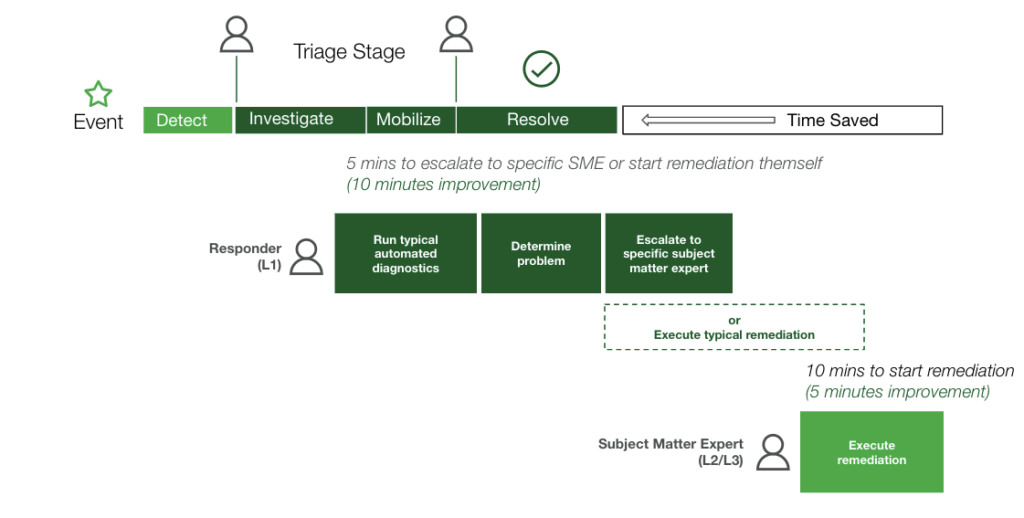
By automating these investigative and debugging tasks, in addition to having the ability to delegate these actions across teams and responders, you will experience a positively cascading effect on MTTI, and eventually, MTTR.
So why should you care about automated diagnostics?
With automated diagnostics, you can:
- Reduce escalations to scarce experts by designing paths to provide the first-responders with information that would typically be manually gathered
- Distribute subject matter expertise across response teams
- Invoke secure automation behind firewalls and VPCs
- Troubleshoot and resolve faster without a human-assisted action required
- Improve the speed of enablement to new engineers and ensure optimal efficiency at all levels of the incident response organization
Getting Started
You made your decision. Now it’s time to blaze the trail, but where do you start?
To use some marketing slang: don’t try to boil the ocean. Trial some actions that are both low in complexity and risk. This could be taking a deeper look at some of your noisiest services, or you could run some simple data pulls from various monitoring applications, disc usage, etc. But it’s important to have a strategy for the long-term roll out and vision of this functionality. Sure, you can write a script that pulls data from numerous sources and appends that to an incident. But that is far from scalable.
It’s important to think about the various infrastructure pieces and tools you will want to pull diagnostic data from. You will want a standardized approach for interfacing with your heterogeneous and dynamic environments.
To learn more about automated diagnostics, check out some of our how-to articles, which we will be continuing to publish throughout the year. Additionally, look out for a session on all things Automated Diagnostics from Jake Cohen during PagerDuty Summit next week!
For more resources about PagerDuty Runbook Automation portfolio, visit this page and get in touch with your account manager today.