A deep dive into how we built Advanced Analytics
by David Shackelford
September 25, 2014
| 1 min read
Advanced Analytics is now called Advanced Reporting, which includes Team, System, and User Reports. PagerDuty Analytics is a new product that surfaces the most critical trend-over-time operational insights into your people, technology, and process. To learn more, visit PagerDuty Analytics.
Advanced Analytics was a big project for us – not only was it a big step toward helping operations teams improve their performance with actionable data, but it also presented a complex design and engineering challenge.
Designing to Solve Problems
When we design new features, we always want to ensure that we solve real problems for our customers. As we dug into how our customers were using PagerDuty, and the goals they had for their Operations teams, one of the biggest pain points we found was a lack of visibility into what was happening with their operations. While this problem looks different at every company, we noticed many teams struggling with knowing what areas of their system are the most problematic and how their teams are performing.
Designing for Reliability and Scale
We process tens of millions of incidents a month. Since our customers count on us to improve their uptime, the reliability of our product is a core value here at PagerDuty. We needed to ensure that the infrastructure behind Advanced Analytics supported our reliability and performance needs now and in the future.
Reporting load looks different than load on a mobile app or dashboard; rather than needing a small set of incidents right now, you want larger numbers of incidents with calculations from a larger time range.
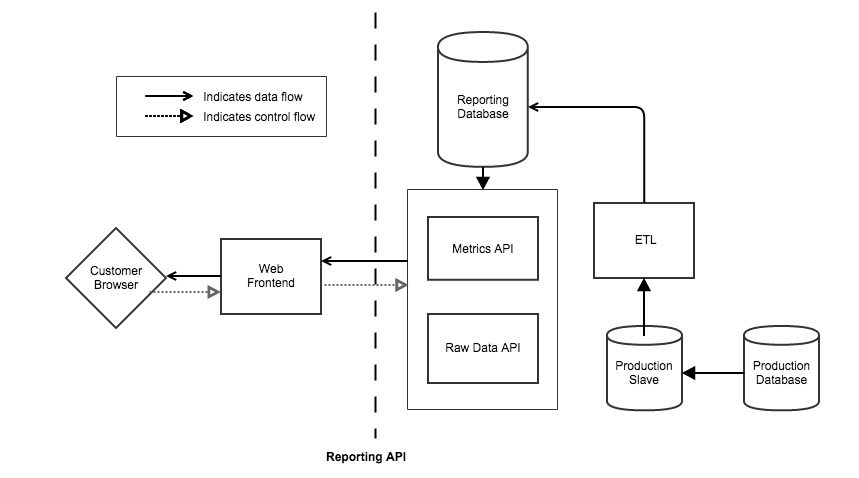
We needed to make sure reporting calls did not bog down our main incidents database and API, so we built a set of decoupled services that ensures we can serve data quickly to customers while avoiding any impact on our main alerting pipeline, web app, and mobile app.
A fleet of ETL workers takes data from a production slave database, iterating over incident log entries and flattening them into a raw facts table with a specific set of metrics. A second service serves up the raw denormalized incidents facts for display in drilldown tables, and the third consumes the raw data to quickly calculate aggregate metrics. When you access a report, these services serve the mix of summary and raw data that you ask for.
Advanced Analytics accesses a large volume of data, so we explored pre-computing some of the metrics. However, pre-computing presents tradeoffs between data staleness, the number of code paths to serve pre-rolled and on-demand reports, and UX design, so we wanted to make sure we did just the right amount. Based on testing, we discovered that by pre-computing per-incident metrics, we were able to strike the right balance of performance and flexibility.
We knew at the start that Advanced Analytics would serve as the foundation for exposing so much new data to our customers — more even than we’d be able to anticipate. That’s why we built our analytics framework to handle change. When we develop new and better ways to calculate valuable metrics, or have even richer usage data to expose, we can re-process data without any interruption to the feature. Customers will simply see new functionality available once all of the data is in place. In practice, this also allows us to deal with temporary fluctuations in data availability or integrity without downtime.
In practice, all this work is invisible to the user – they go to our reports page, select whatever they want to see, and quickly see their data rendered. But it’s important to us that we build our features to the same bar of scale and reliability we’re famous for.
Getting to the “So What?”
It would be easy to just take our existing reports and add filters, but we wanted to do more. We wanted to give users the context and flexibility to take away real, actionable insights from the reports.
We did this in three ways:
- Presenting individual metrics alongside aggregate summaries, so that customers can norm how a particular team or service is doing compared to the greater whole.
- Showing how metrics have changed since the last time period, so that customers understand at a high level whether they are improving their performance.
- Offering quick, simple drilldown to the underlying incidents, services, escalation policies, and users, so that customers can access the granular details of their operations activity.
Learning and Iterating
We collected customer feedback throughout our design and development process, and to make sure we were ready to ship, we ran a comprehensive beta test with select groups of customers. Throughout this process, we got great feedback that helped us iterate to deliver the best possible solution.
Beta customers took instantly to the new reports, excited to have greater visibility into their systems and people, and eager to share how they wanted to use the feature to enact positive change in their teams. Some of our favorite use cases:
- Identifying teams (escalation policies) with the lowest median times to resolve, so that other teams in the same company could learn from their operational practices and improve ops metrics companywide
- Using the Team Report for weekly team meetings, reviewing how key metrics have changed from the previous week, and looking at escalated incidents to identify what went wrong
- Using the incident drilldown to see where similar incidents occurred together, and finding duplicate or noisy alerts to remediate
Speaking with beta customers also provided us a great deal of UX feedback. Throughout our alpha and beta, we made UX and usability tweaks to ensure that our interactions were supporting the needs of our widely-varied customer base — from those with only one or two users and services up to those with hundreds.
While we’re thrilled to deliver this comprehensive solution to operations reporting, we see this as just the first step in PagerDuty’s analytics journey. We’re excited to continue helping our customers improve their uptime & reliability through analytics.
Tell us what you think!
Advanced Analytics is live as a 30-day preview to all customers, after which it will be a feature of our Enterprise plan. We’d love to hear what you think – email support@pagerduty.com with any feedback, and we promise we’ll read every single piece of it.