
- PagerDuty /
- Blog /
- Best Practices & Insights /
- Making the Most of PagerDuty + Datadog
Blog
Making the Most of PagerDuty + Datadog
by David M. Lentz
October 10, 2019
| 6 min read
For your team to effectively respond to incidents, you need a shared, unambiguous incident definition so you can recognize when an incident has occurred and assign the appropriate severity. Definitions of an incident differ across teams, but whatever definition you use, identifying and monitoring key service level indicators (SLIs) can help you understand when your service is operating normally—and when its performance has degraded to the point where you need to trigger an incident.
Datadog can help you monitor and alert on your infrastructure and application performance metrics—including your SLIs. In this post, we’ll walk through four best practices for using PagerDuty with Datadog to enrich and accelerate your incident response process and reduce your mean time to resolution (MTTR).
- Base Incidents on Meaningful SLIs
Datadog makes it easy to collect all the metrics that are potentially useful to you, but not all metrics are SLIs. A good SLI is a metric that measures a behavior that’s meaningful in delivering your intended level of service. For example, if you operate an API and your objective is to minimize latency, you should use response time as your SLI, even though you may also be monitoring the API’s response rate, error rate, and the system load of its servers.
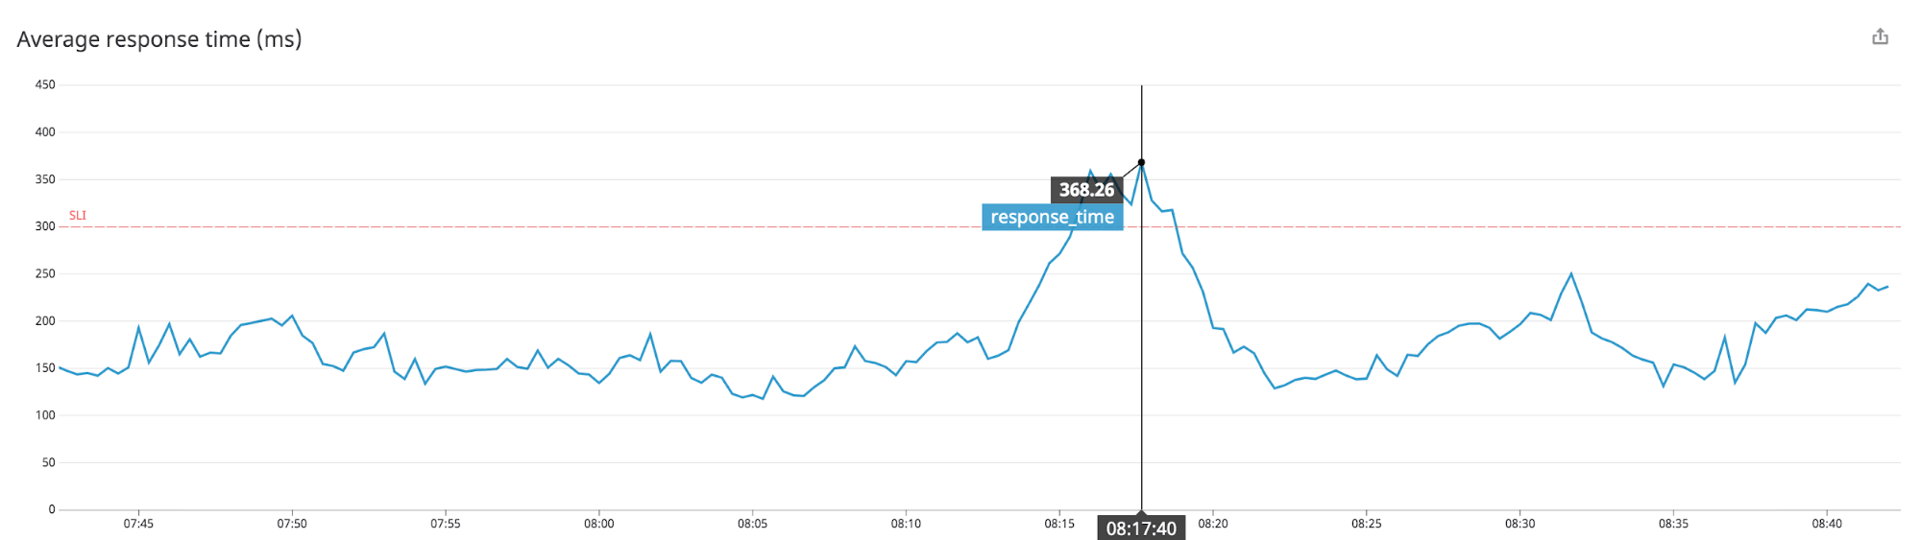
Service level objectives (SLOs) are your team’s targets for the performance of your service or application. The example SLI above (response time) can be used to define an SLO such as “respond to 99.99 percent of requests in under 300 ms.” Service level agreements (SLAs) are your organization’s commitments to your customers. Each SLA is made up of an SLO plus a consequence for not meeting that SLO, such as a partial refund of the monthly fees paid by the customer.
For your organization to meet its SLAs, your team needs to succeed in meeting your SLOs. To track your progress, you should identify and alert on the right SLIs. If an SLI is breached, it’s a clear priority: you should create an incident and rely on PagerDuty and your team’s incident response process to correct any behavior that doesn’t meet your SLO.
- Trigger Incidents Automatically From SLI Alerts
To reliably detect an incident and start your response quickly, you should automate the process of triggering an incident when an SLI crosses a threshold. When you integrate PagerDuty with Datadog, an alert in Datadog can immediately trigger an incident in PagerDuty, kicking off your team’s incident response process. To create an incident automatically, define an alert in Datadog based on an SLI, and @-mention PagerDuty in the body of the alert.
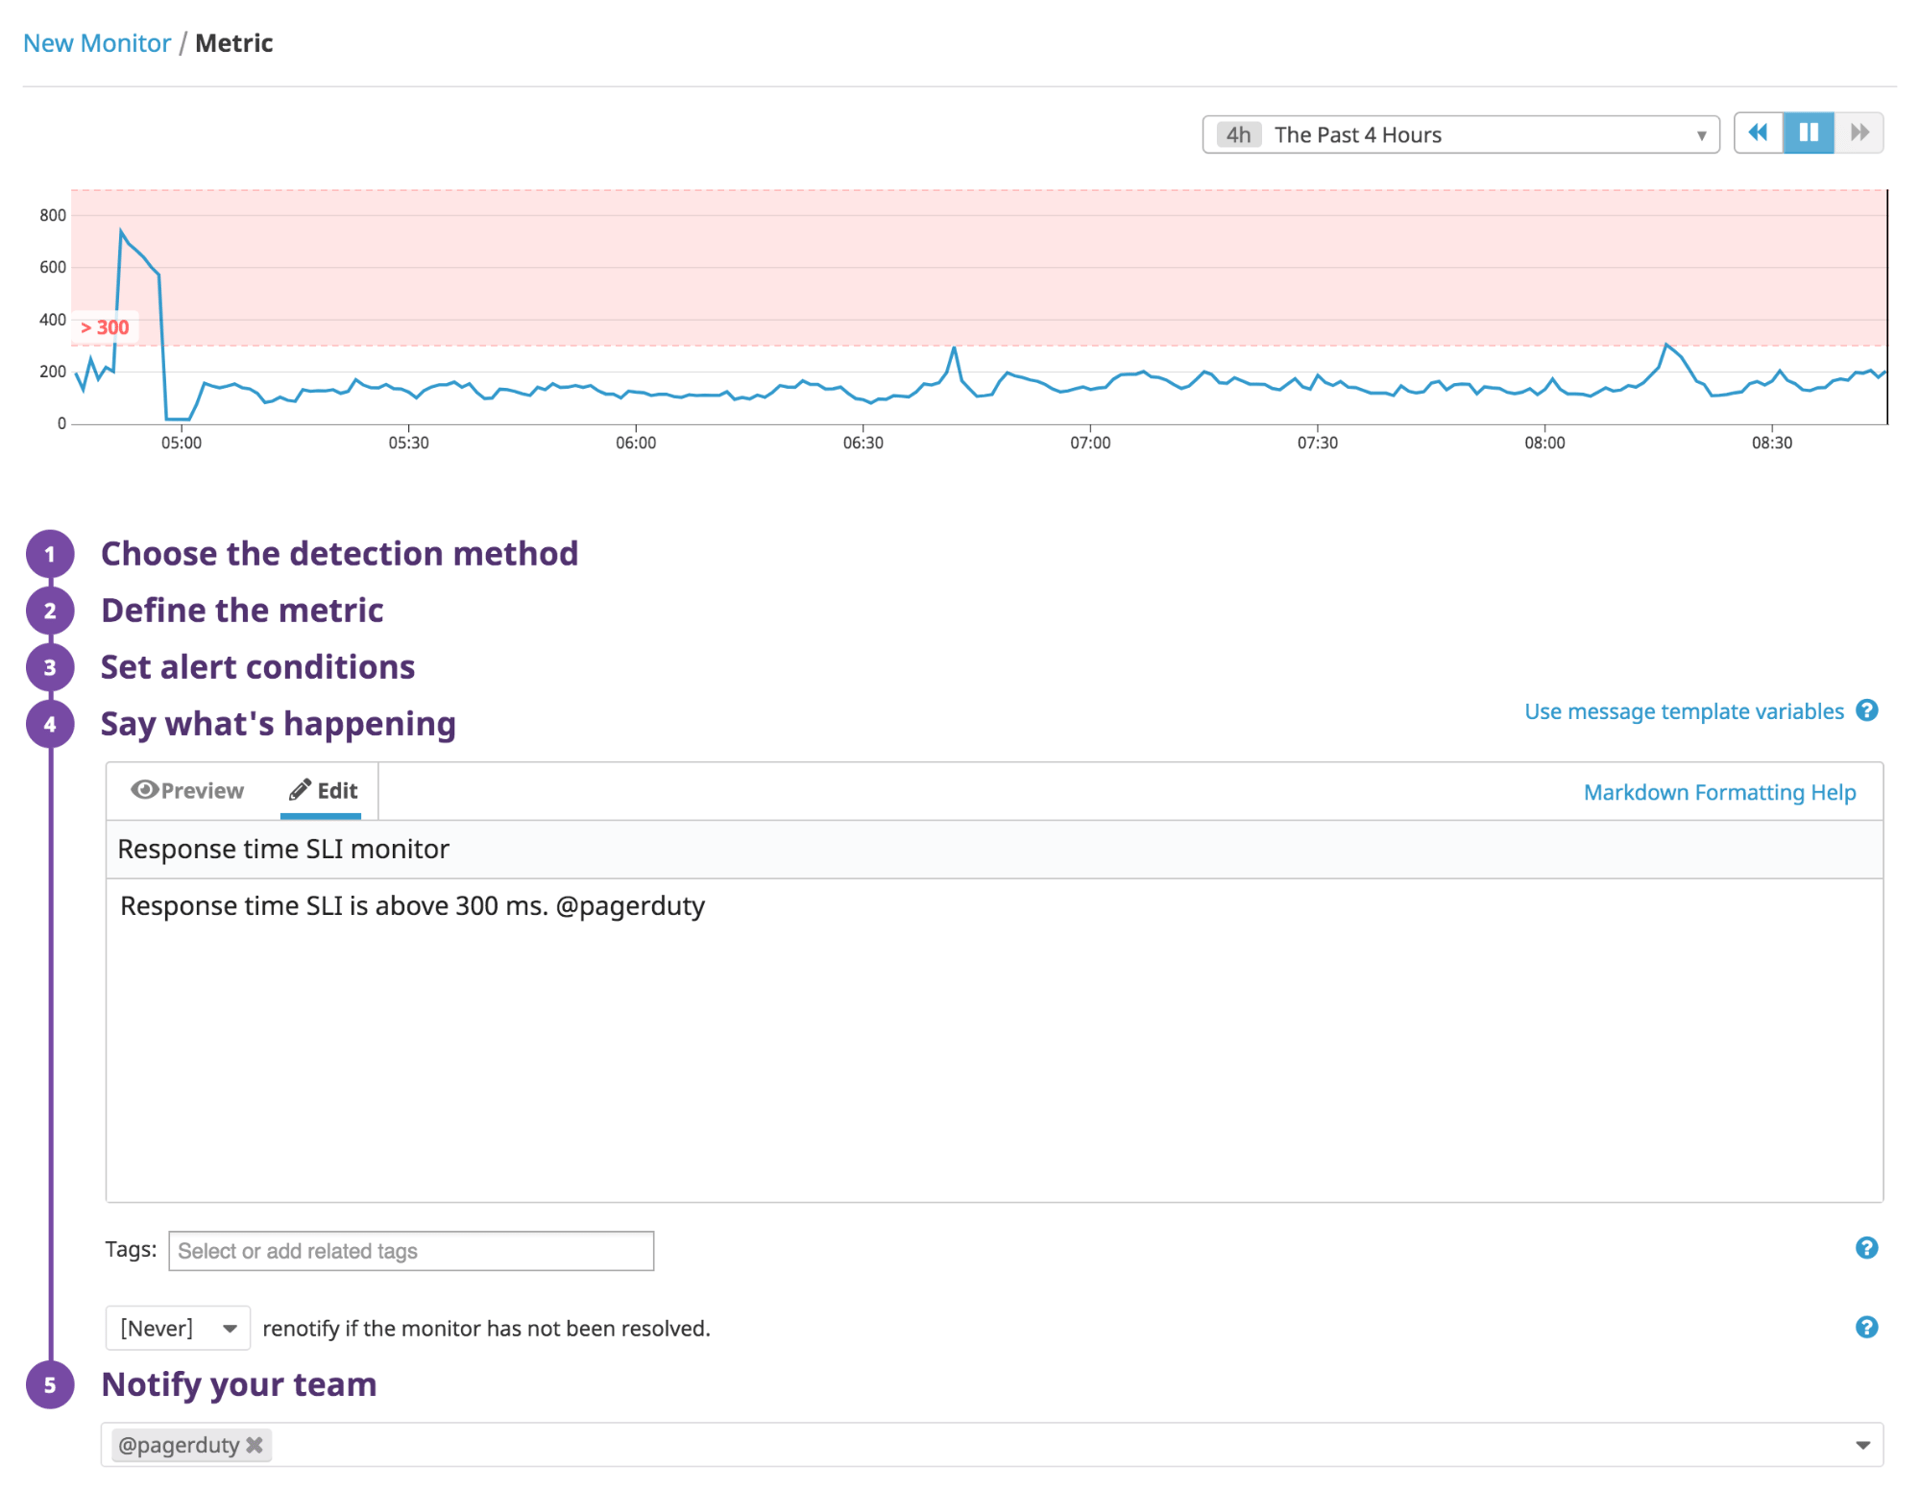
When the alert triggers, an event will appear in your Datadog event stream and the integration will create an incident in PagerDuty. If the metric returns to a non-alerting state on its own, the integration will automatically resolve the incident in PagerDuty. This way, your incident response team doesn’t need to act, but PagerDuty retains the history of the incident for future reference.
In addition to speeding up your response process, triggering incidents automatically can ensure that you have a reliable history of times when your team missed your SLOs. You can see this historical data in the PagerDuty incident trends report, which shows how many incidents were triggered, when, and which PagerDuty services were affected.
- Start Your Incident Response Well Informed
To accelerate incident resolution, your responders need context and current information about each incident—including current monitoring data from the service(s) involved, as well as any potentially impacted dependencies. You can configure each PagerDuty service to include a relevant Datadog graph, or an entire dashboard, in each incident. This enables responders to view data showing the status and history of an incident’s underlying SLI, plus related metrics that help them assess the health of any upstream and/or downstream components and services.
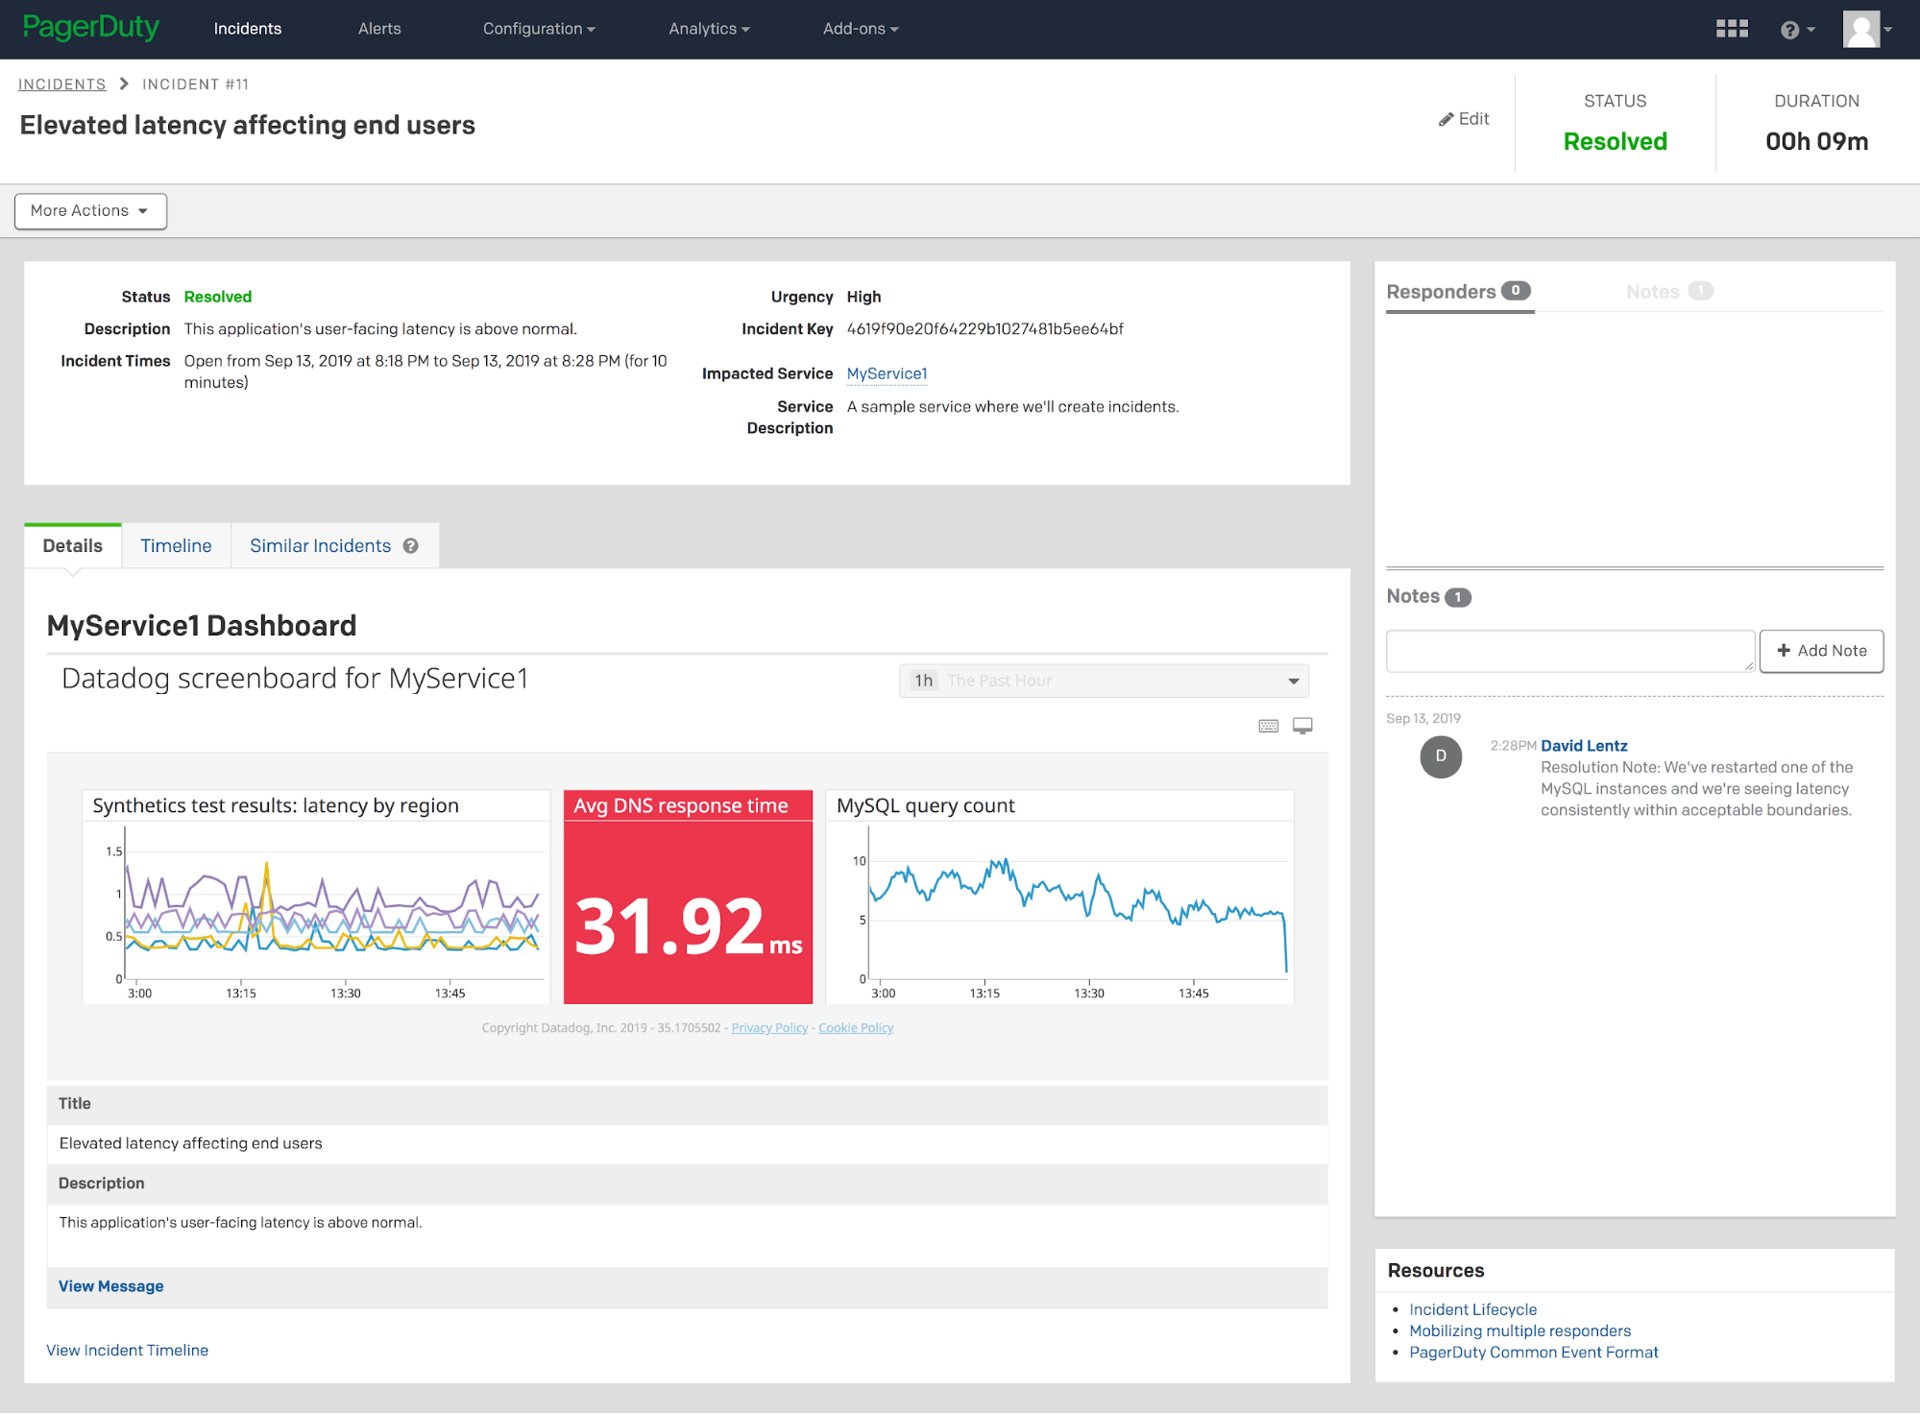
If you’re using synthetic tests in Datadog to confirm the availability and performance of API endpoints that your service or application relies on, you can include the test results on the Datadog dashboards that get displayed in your PagerDuty incident pages. This allows responders to immediately see the status of upstream services during an incident. If the dashboard reveals that an incident is caused by an outage in a third-party dependency, you could reconfigure your application to use a different service instead.
You can also collect monitoring data from your application’s own internal components (like endpoints, databases, caching engines, and DNS) and display it on your incident dashboards, as shown in the screenshot above. Monitoring the performance of these components can help you spot issues that could explain the cause of an incident.
- Integrate Both Ways
By integrating PagerDuty with Datadog, you can seamlessly add and update real-time incident information across both platforms to ensure that team members have complete and current information close at hand.
Incident information you collect or create in PagerDuty can be automatically sent to Datadog to ensure that all teams have information about the incident. You can configure the integration to continually update your Datadog event stream with information from your PagerDuty incidents—such as when an incident is acknowledged or delegated. You can overlay those events on Datadog graphs to correlate them with metrics so you can investigate the scope, impact, and potential causes of an incident.
As your team updates an incident in PagerDuty—for example, to resolve the incident or to annotate it by adding a note in the **Notes** field in the PagerDuty UI—you can see those changes automatically appear in the Datadog event stream.
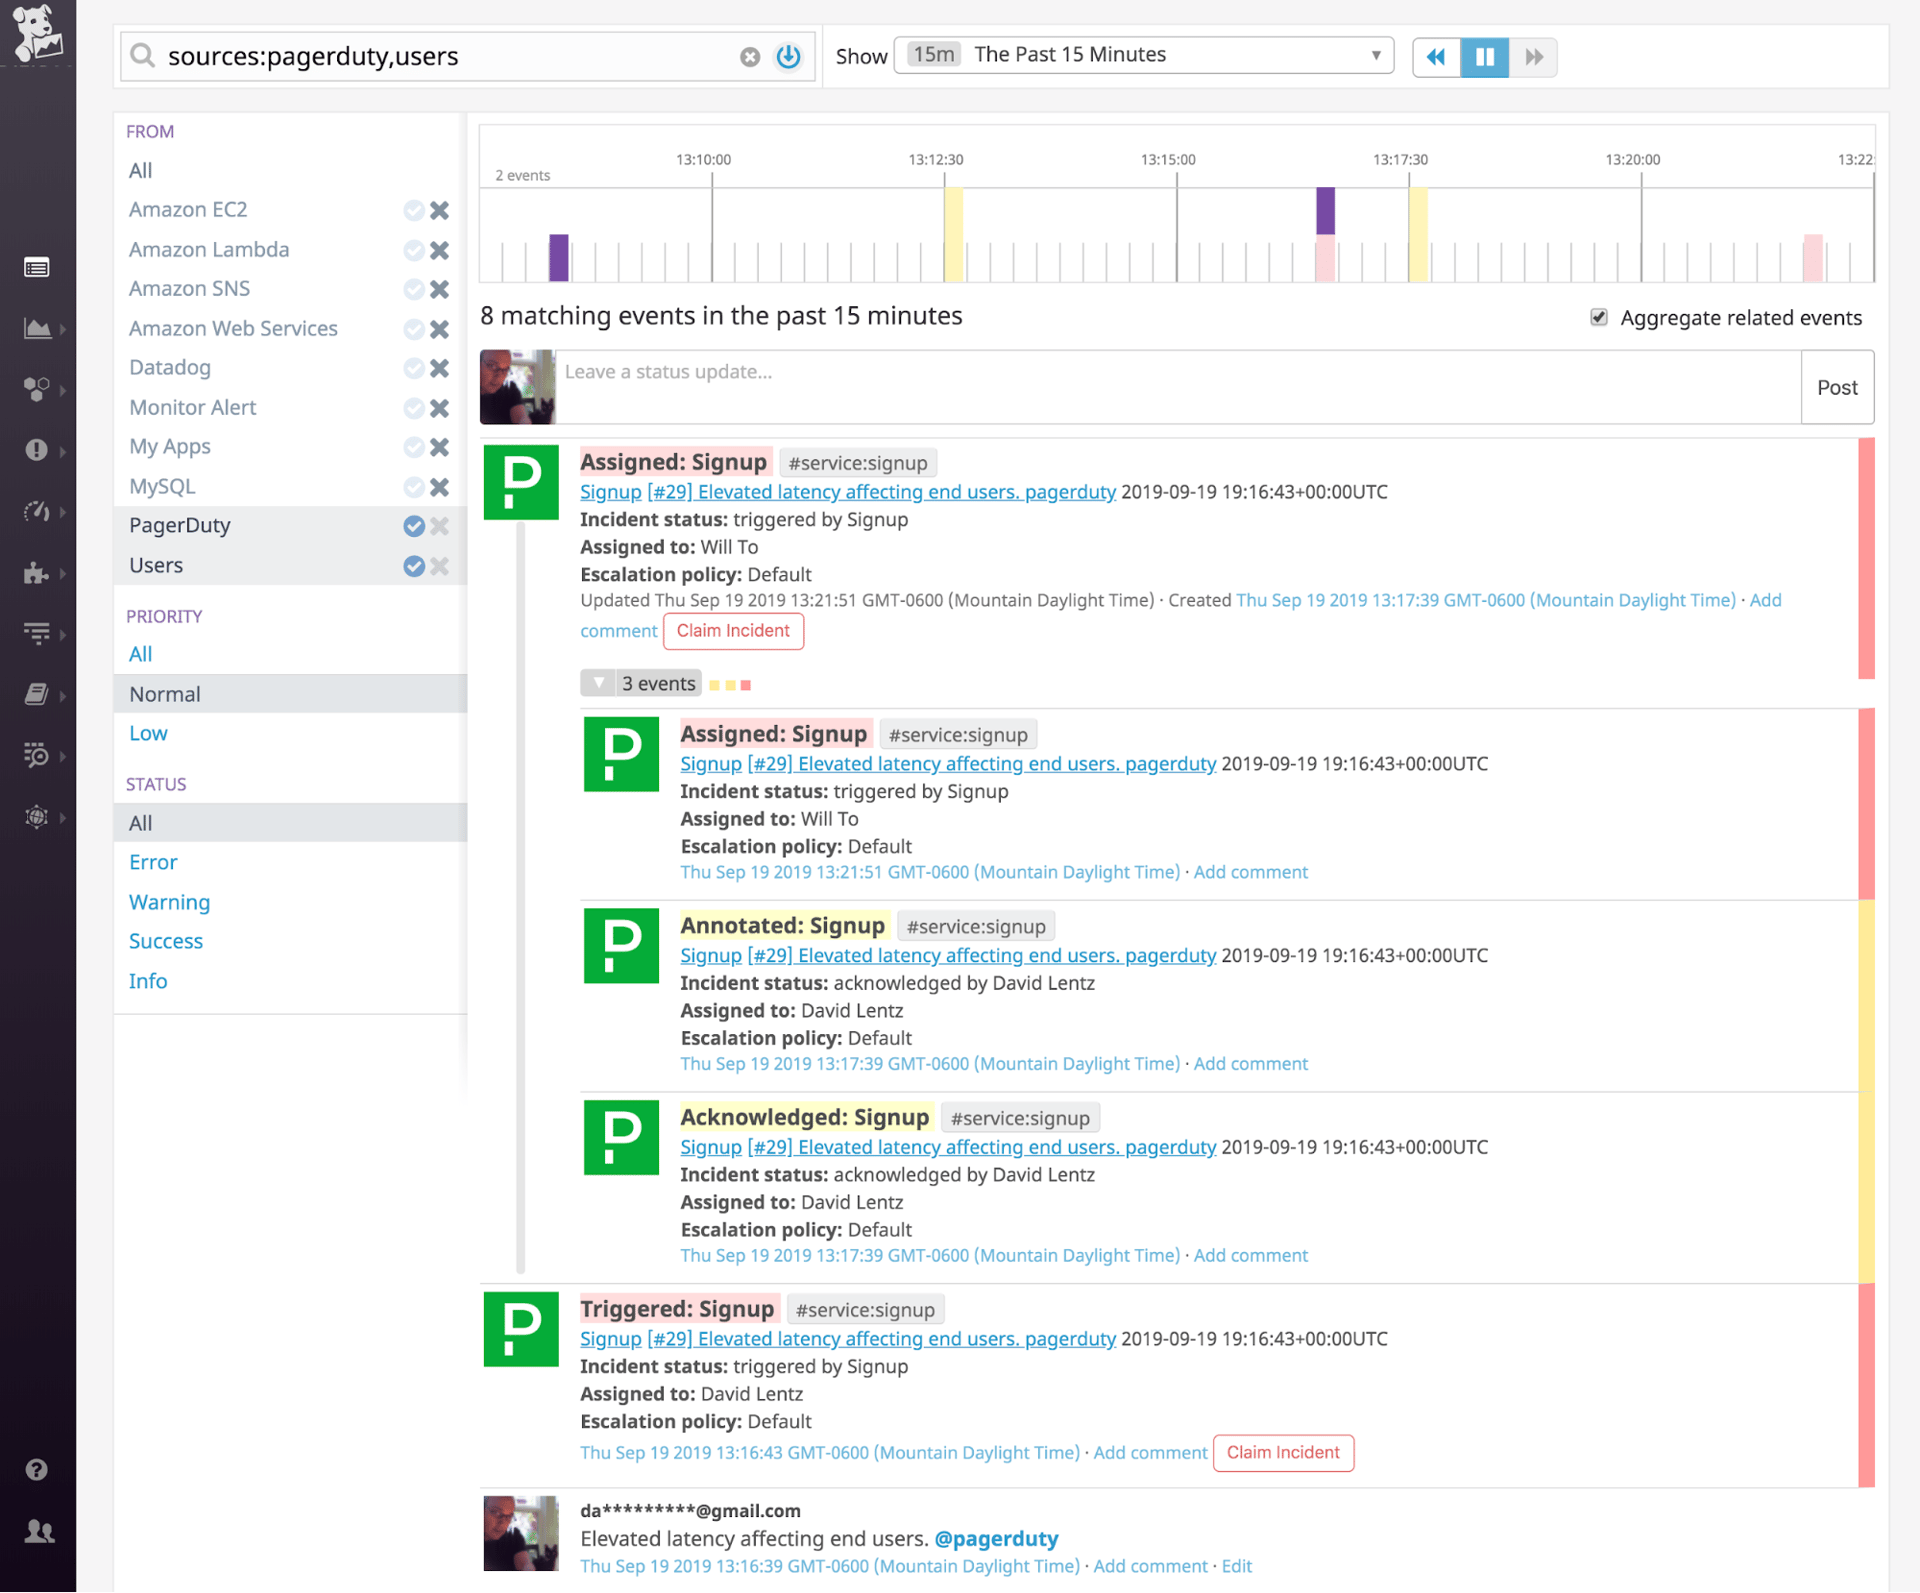
You can also configure the integration to automatically add your Datadog monitoring information to your PagerDuty incidents. When an alert triggers in Datadog, it can automatically create an incident in PagerDuty, but you can also manually create an incident at any time by posting an event that mentions @PagerDuty in your Datadog event stream.
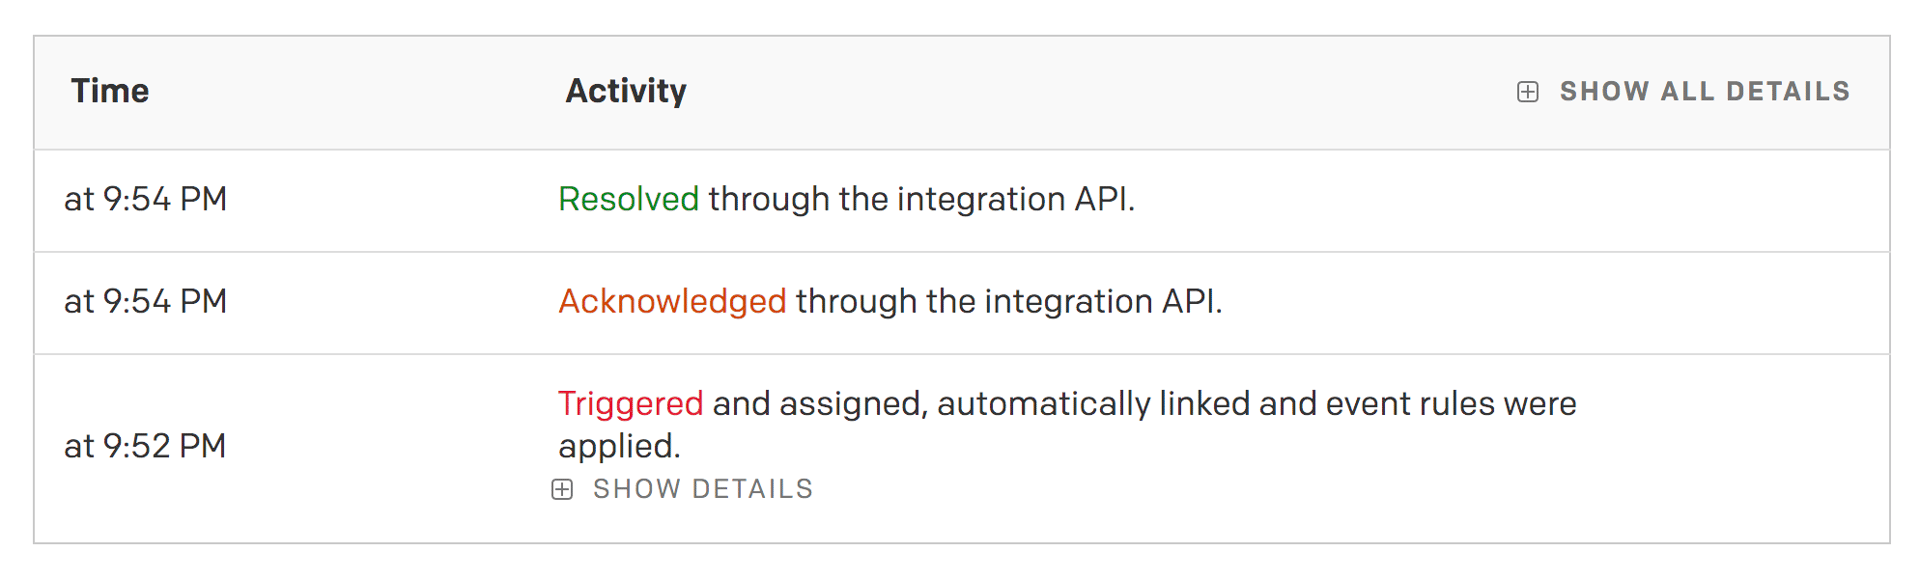
To acknowledge or resolve the incident directly from the event stream, add a comment to the event that mentions @PagerDuty-acknowledge or @PagerDuty-resolve. The result is that the incident is updated—acknowledged and resolved—as if those changes had been made within the PagerDuty UI, as shown in the screenshot below.
Make the Most of PagerDuty + Datadog
A fast and effective incident response can help you minimize any negative effects on your users and your business. Integrate PagerDuty with Datadog to trigger incidents automatically, visualize relevant data in a single view, and reduce your MTTR. If you’re not already using Datadog, you can start with a free 14-day trial.

