- PagerDuty /
- Blog /
- Automation /
- Debug State Capture for Traditional Infrastructure & Apps
Blog
Debug State Capture for Traditional Infrastructure & Apps
by Justyn Roberts
May 25, 2023
| 5 min read
In our previous blogs on Capturing Application State and using Ephemeral Containers for Debugging Kubernetes, we discussed the value of being able to deploy specific tools to gather diagnostics for later analysis, while also providing the responder to the incident the means to resolve infrastructure or application issues.
This drives a balance between the need to restore a service as quickly as possible, in addition to ensuring enough debug data is available for a later permanent resolution—all while allowing a development team to keep a container running lean and in a performant way.
By capturing both application and environment state when the incident occurs, any responder or service owner spends less time context switching between tools, credentials, and environments—enabling more accurate and faster responses and problem resolution.
The techniques discussed in the prior blogs in this series focussed around modern, cloud-native platforms like Kubernetes, and the unique approaches needed for containers—especially containers that do not natively ship with debugging tools.
Not everyone is able or willing to move every application to cloud native, and many of us still work within a hybrid scenario of both containerized and traditional applications.
Even without the ephemeral nature of containers and the strict policies of container images, there is still a need to capture in-the-moment evidence to help with root-cause analysis in order to avoid future occurrences of incidents.
Let’s look at use cases describing the ability to capture state automatically in the event of a failure or decreased performance, and pick some interesting scenarios to dive into for a deeper look.
This is a non-exhaustive list, but here are some examples of how debug state capture is used in traditional application environments:
Infrastructure & Network
- Top resource-consuming processes on one or more infrastructure components
- TCP dump; thread/memory/core dump
Database
- Top resource consuming queries
- Current query state
- Execution of application specific queries
Application specific
- Java – Run thread/heap dump with tools like jstack
- Windows – Proc Dump
- Python – Running thread dump
- All – Application specific log files
Additional Log Files
Debug state capture can grab whole or partial logs from any file that may not be captured by a log aggregator.
PagerDuty Process Automation provides many pre-built template workflows for capturing application and environment state as part of the automated diagnostics project. These workflows are flexible and extendable so that they can be customized to work for your particular use-cases.
Taking a Deeper Dive
Let us take a closer look at some specific examples of capturing environment state that could prove useful at identifying the long-term fix for an incident.
Use case 1 – Gather database debug
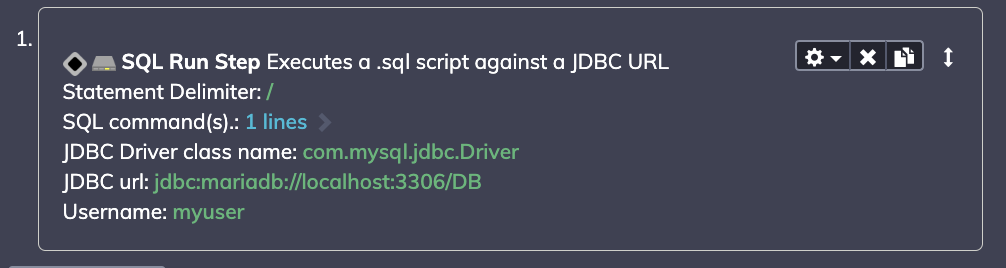
We can use the SQL RUN Step in Process Automation to add either an inline statement, or execute an existing script. As my application is MariaDB (A fork of MySQL), I can use the following parameters to run the MySQL query:
SHOW FULL PROCESSLIST;
(Note: credentials are derived from my existing external store and passed securely as I execute the step as part of a workflow, so I can safely delegate without exposing info)
I pass the output to my Incident platform (In my case, PagerDuty, of course), and set the job to collect automatically if an incident occurs within the database service.
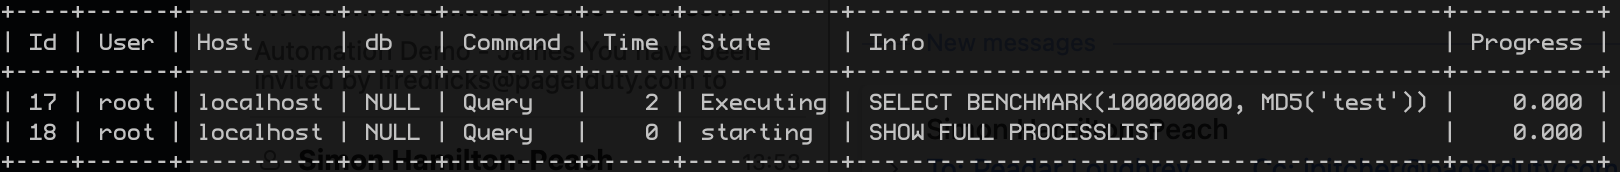
This info is now automatically available to both my responder in their app, chatops tool, or within any post mortem. In this case, I can see someone is running a benchmark test at the point of incident! As with the previous blog posts, it would also be easy to post more complex versions of this to a storage environment like an AWS S3 Bucket for later analysis.
Use case 2 – Gather application debug
My observability tool is very quick to let me know WHEN an application has failed, but not always the information on WHY it failed. This second use case will run an ad hoc command for my python application to use py-spy, a sampling profiler for my application, in conjunction with one of our automation plugins to move files securely to S3 for later retrieval.
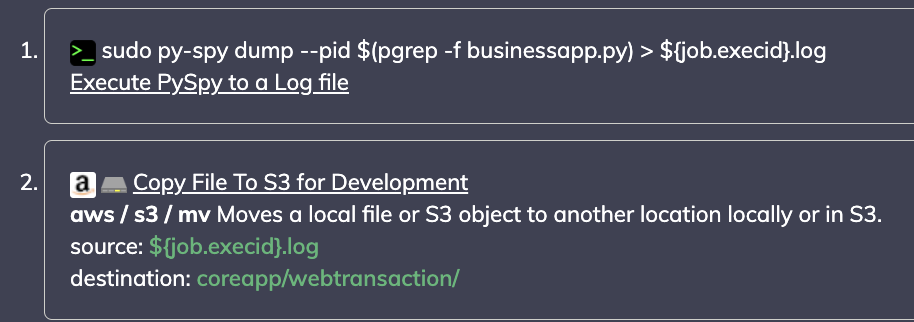
Outputs data direct to my S3 storage :
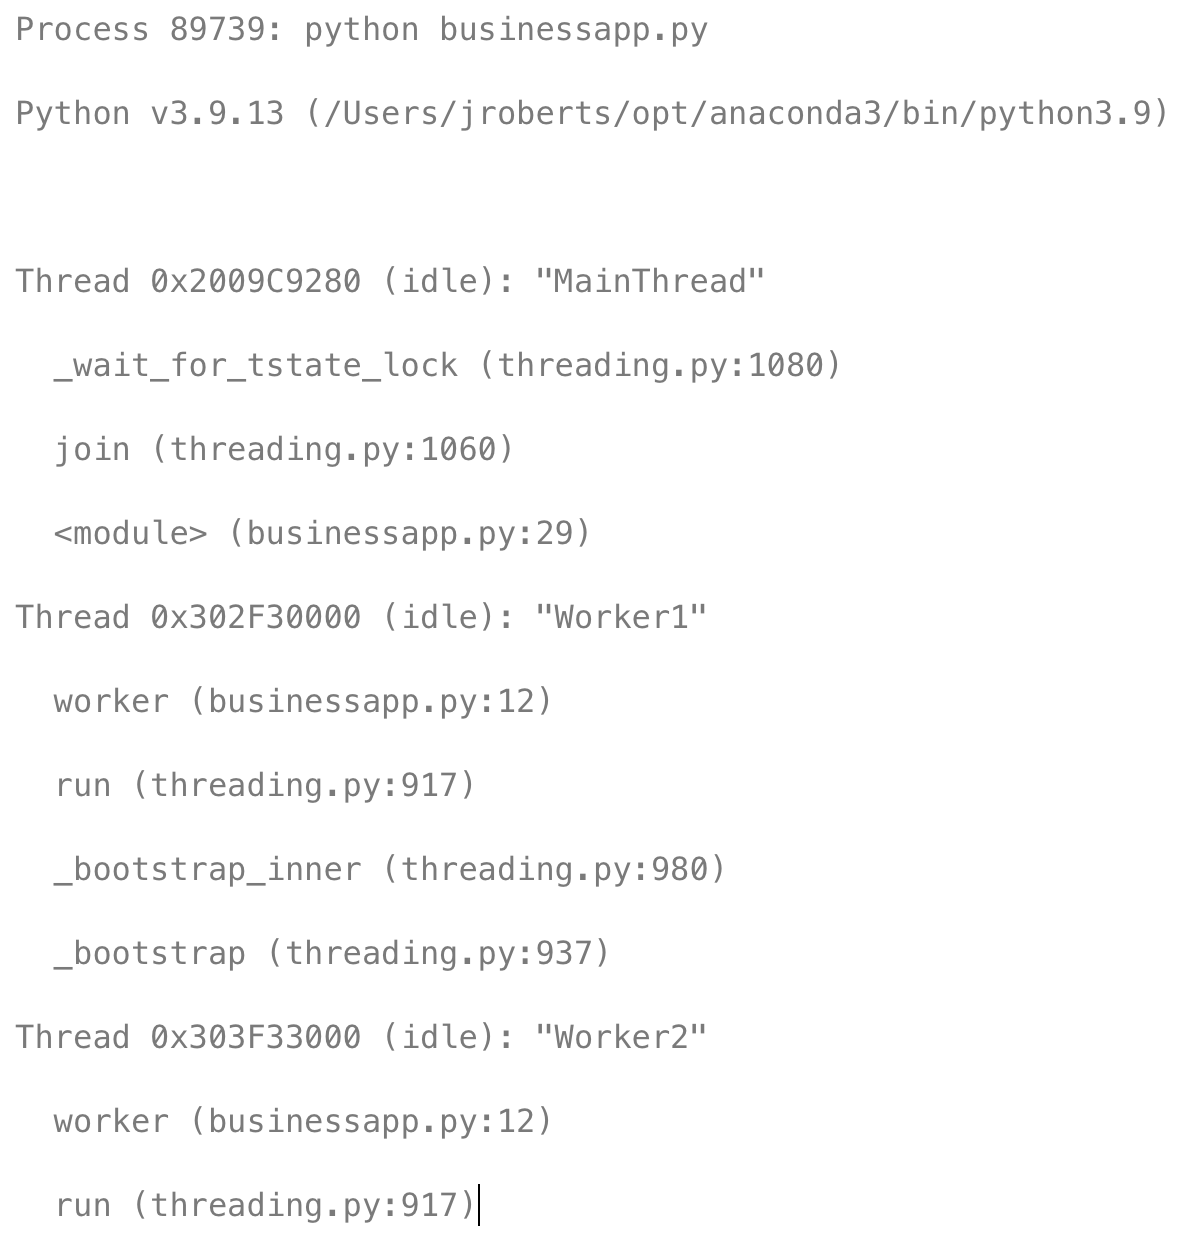
This example highlights worker states for my python app at a thread level, straight into the hands of my developer, and stored for as long as they might need to reference.
Of course, these commands are not exclusive, and I could easily chain multiple checks to provide a broader view.
Use case 3 – Traditional Infrastructure debug state capture
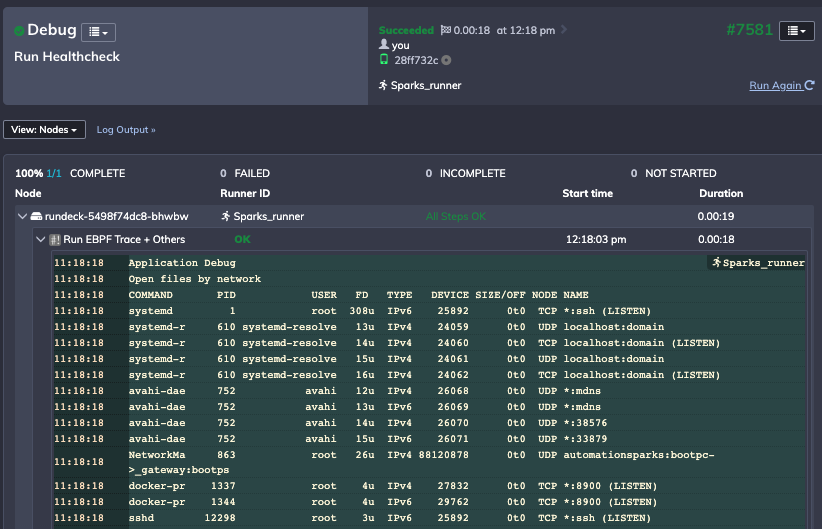
For the third use case, I need to deploy a set of bash commands to a remote machine and run again at the trigger event. This primarily surfaces diagnostics such as open files and network connections, but it also runs bpftrace, a tool that can be used for tracing specific calls:
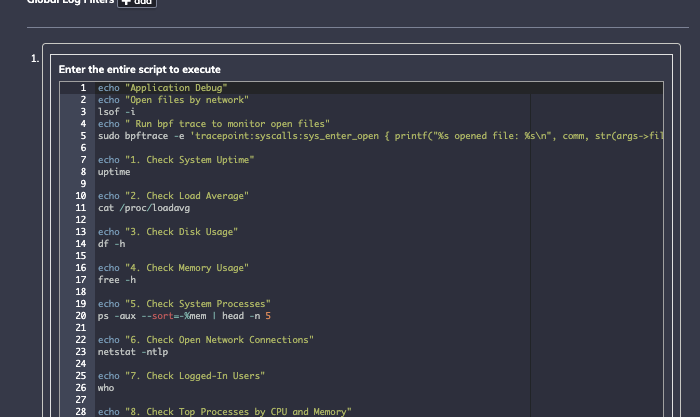
Process Automation allows me to define and deploy a whole script and store the output for gathering a snapshot of my environment state:
Conclusion
Signals from monitoring tools, even in traditional environments, benefit from broader visibility to allow any responder, DevOps engineer or SRE to make quick and safe decisions. Developers also often need additional information and the ability to capture state when problems arise, as they might not be on hand immediately.
Debug State Capture enables this, providing additional context for a responder, reducing time spent digging around in different tools and the capability to collect deeper datasets for subsequent analysis.
Curious to learn more? Get started today with a trial of Runbook Automation.