- PagerDuty /
- Blog /
- Integrations /
- How to Get Real-Time Visibility Into Serverless Apps
Blog
How to Get Real-Time Visibility Into Serverless Apps
by Steve Gross
May 1, 2019
| 5 min read
As CEO and co-founder of IOpipe, Adam Johnson works with both individual developers and engineering teams at global enterprises to get real-time visibility into the detailed behaviors of their serverless applications.
According to The New Stack’s 2018 ebook, serverless adoption has grown by 75 percent since 2017, but developers continue to cite concerns about application performance, risk, and monitoring as drawbacks to building on a serverless architecture.
Despite advancements made in observability tools in the past year, alerts for performance anomalies and user disruptions is a crucial, yet still overlooked, component for engineering teams to deliver serverless applications with confidence. With this in mind, Adam shared some of the challenges he has faced in this industry, along with best practices and technical tips in this Q&A.
Q: In what ways does monitoring differ for serverless applications versus traditional architectures?
A: The major difference with serverless monitoring is that there is more focus on the business logic flowing through the system and a de-emphasis on the infrastructure side of things. With serverless architectures, infrastructure issues are largely outside of your control, handled by the cloud providers running the function-as-a-service (FaaS) platform. This frees up companies to focus on the impact of the business instead.
For example, some of the major ecommerce brands using IOpipe create alerts based on expected order volumes, so when there’s an unexpected dip (or spike) in orders, they can get notified within seconds if something is out of the ordinary.
While building on serverless provides advantages in terms of velocity and cost, many developers are still struggling to gain observability into the behavior of their serverless applications. For instance, how do you trace millions of invocations to find which users were impacted by a performance issue? If a problem arises, how do you quickly isolate the guilty function or functions to minimize business disruption?
Traditional monitoring isn’t necessarily set up to handle the differing challenges of serverless architectures or maximize the chance developers and DevOps teams have to translate infrastructure metrics to business insights as they shift performance and scaling burdens to the cloud providers.
Q: What are some of the advantages and disadvantages of serverless over monolithic applications?
A: The biggest advantage serverless has over monolithic applications is that it frees up developers to focus entirely on building and shipping business logic. This enables companies to deliver value to their customers, faster. Developers no longer have to spend time focusing on coding and configuring infrastructure to plan for scaling events. Scaling is taken care of out of the box. On top of shipping faster, you’re only charged for what you use in serverless. So there are typically some significant cost benefits, with companies reporting savings of up to 90% when moving away from VMs and containers.
The major disadvantage is that unless you set your concurrency level to 1, you’re running a distributed system. This can create new sets of challenges, especially when it comes to getting observability around these systems. Fortunately there’s a crop of next-gen tooling that provide granular insights into serverless applications, even improving in the visibility from legacy monolithic applications.
Q: What are some common performance culprits on serverless architecture?
A: One of the most discussed issues around serverless performance is around cold starts, which is when there is a small delay in spinning up a new container. Fortunately for languages such as Node.js and Python, cold start impacts have been dramatically reduced down to single-digit milliseconds in AWS Lambda. For other languages like Java, cold starts can still have a significant performance impact.
However, serverless observability tools like IOpipe can provide visibility into cold start performance. This helps users understand the true impact and whether it’s something worth optimizing.
Q: For a company or developer new to serverless, what are some standard alerts they should implement right out of the gate?
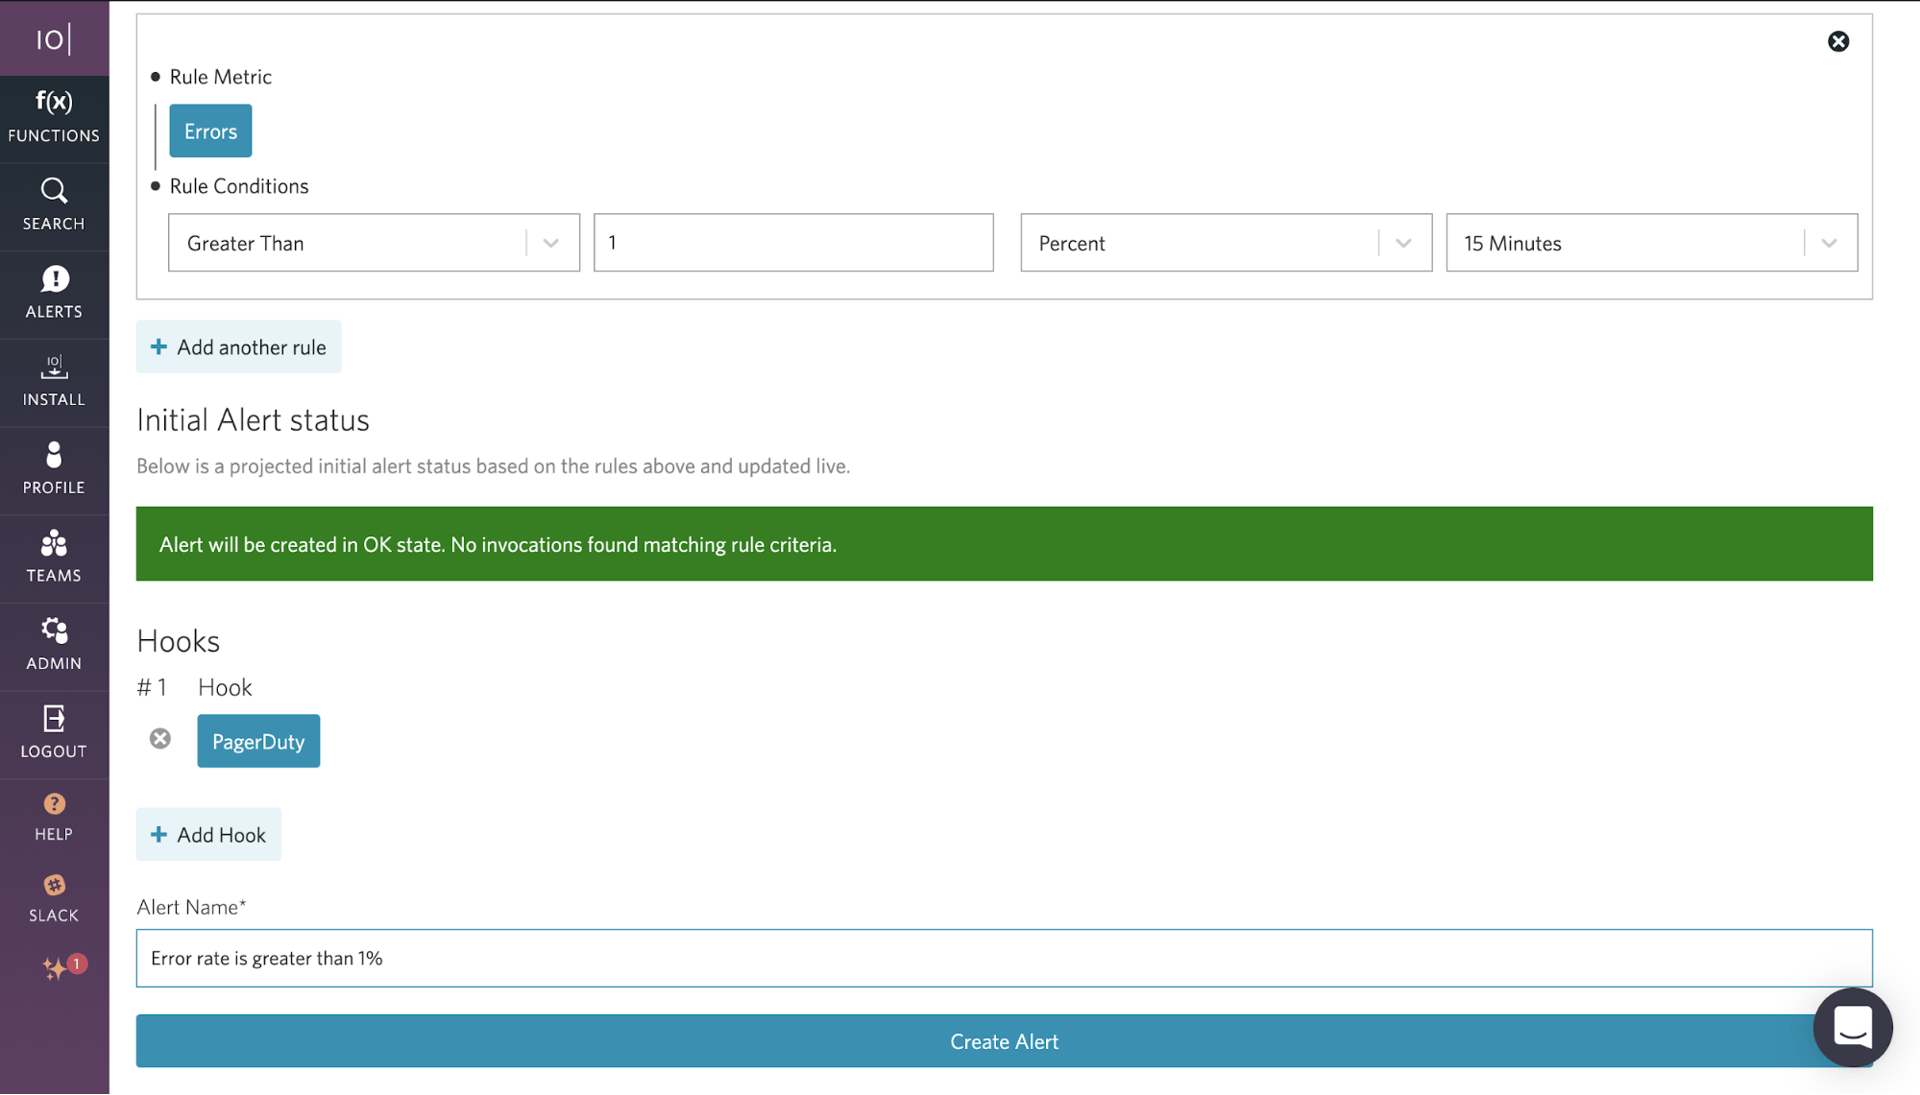
A: The first alert that IOpipe customers typically set up are on application failures. Many customers will set up alerts on the error rate of their serverless applications, so they can get notified as soon as the error rate passes outside their comfort threshold.
Another highly recommended alert is a drop-in invocations for functions that are expected to run a certain number of times per time period. So if they expect a function to run at least once per day, they should set up an alert to notify them whenever the function doesn’t run that day.
For serverless applications that are processing a stream or batches of data where the volume is fairly predictable, setting up alerts on upper and lower thresholds of invocation counts is a helpful way to identify when there’s an issue in the data pipeline.
Q: How should developers or DevOps teams deal with debugging across the increased volume of function logs inherent to serverless?
A: Investing time into instrumenting serverless applications with structured logs and labels can completely eliminate the need to dig through log files ever again. A little upfront effort can save hours or even days of valuable debugging time when a problem arises.
Q: How do developers integrate serverless monitoring with their existing PagerDuty account?
A: IOpipe offers native integration with PagerDuty. With just a few clicks, developers can get notified via PagerDuty whenever their alerts are triggered.
Partnering with PagerDuty and providing serverless observability and monitoring for organizations like Rackspace, Matson, and Comic Relief, IOpipe recently released an overhaul to their serverless alerts features for Python, Node.JS, Go, and Java runtimes on AWS Lambda.
Want to learn more? Check out the PagerDuty – IOpipe integration guide.