- PagerDuty /
- Blog /
- Announcements /
- New! Common Automated Diagnostics for AWS Users
Blog
New! Common Automated Diagnostics for AWS Users
by Jake Cohen
August 3, 2022
| 4 min read
Today’s modern cloud architectures centered on AWS are typically a composite of ~250 AWS services and workflows implemented by over 25,000 SaaS services, house-developed services, and legacy systems. When incidents fire off in these environments—whether or not a company has built out a centralized cloud platform—distinct expertise is often a necessity. Because of this scaled complexity, first responders find themselves having to escalate to several different service owners or expert engineers to gather diagnostics before it’s possible to determine who an ultimate resolver of an issue should be.
When it comes to incident response, it’s critical that these new cloud environments seamlessly integrate with an organization’s existing critical applications and services—both old and new. In light of enhancing service quality and making it easier for responders to cross that bridge of expertise, we are excited to announce the immediate availability of new AWS plug-in integrations for automated diagnostics.
New AWS Plugins for Automated Diagnostics
Our new AWS plugins for Automated Diagnostics help provide deeper coverage for customers that are also users of AWS, making it easier to get up and running with automated diagnostics in their AWS environment quickly.
The new AWS plugins for Automated Diagnostics include:
- CloudWatch Logs plugin. This plugin retrieves diagnostic data from AWS infrastructure and applications. Now users can more easily run automated diagnostics for AWS across multiple accounts and products.
- Systems Manager plugin. This plugin allows for faster execution and accuracy for tasks such as configuration management, patching, and deploying monitoring and security tooling agents. Users are now able to apply automation to the above tasks for faster execution.
- ECS Remote Command plugin. This plugin provides a mechanism to execute commands on containers. This enables developers and operators to retrieve diagnostic data from their running applications in real-time before redeploying their services.
- Lambda Custom Code Workflow plugin. Create, execute, and optionally delete a new Lambda function with the custom code provided in a Job step as its input. Execute custom scripts as steps in jobs without having to install any software.
Sound complex? Don’t worry, we thought of everything :).
New Auto-Diagnostic Job Templates for AWS Users
We also released new pre-built templates for AWS, so you can start enhancing incident details for your specific environments immediately. These are purpose-built to be used with minimal configuration. Instead of starting from scratch, users now have a library of curated, ready-to-use job definitions that retrieve data for investigating, debugging, and triaging incidents during a response.
New users can start automating diagnostics for AWS faster and existing users can easily add AWS diagnostics to their existing PagerDuty Process Automation project.
Some example job templates include:
| AWS – EC2 | Instance Status & Associated IAM Roles | Retrieve EC2 Instance Status and Associated IAM Roles | Remote command (or SSM) |
| AWS – ECS | Stopped ECS Task Errors | Checks stopped ECS Tasks for errors and provides detailed information on the reason for the errors. | Stopped ECS Tasks |
| AWS – ELB | Retrieve ELB Targets Health Status | Retrieve the list of unhealthy Targets in the Load Balancer’s associated Target Groups. | ELB Instance Statuses |
| AWS – RDS | Check Database Storage Status | Checks RDS database for the instance status. | RDS Instance Status |
| AWS – VPC | IP addresses using UDP transfer protocol | Query CloudWatch logs to identify any hosts using the UDP transfer protocol. | CloudWatch Logs |
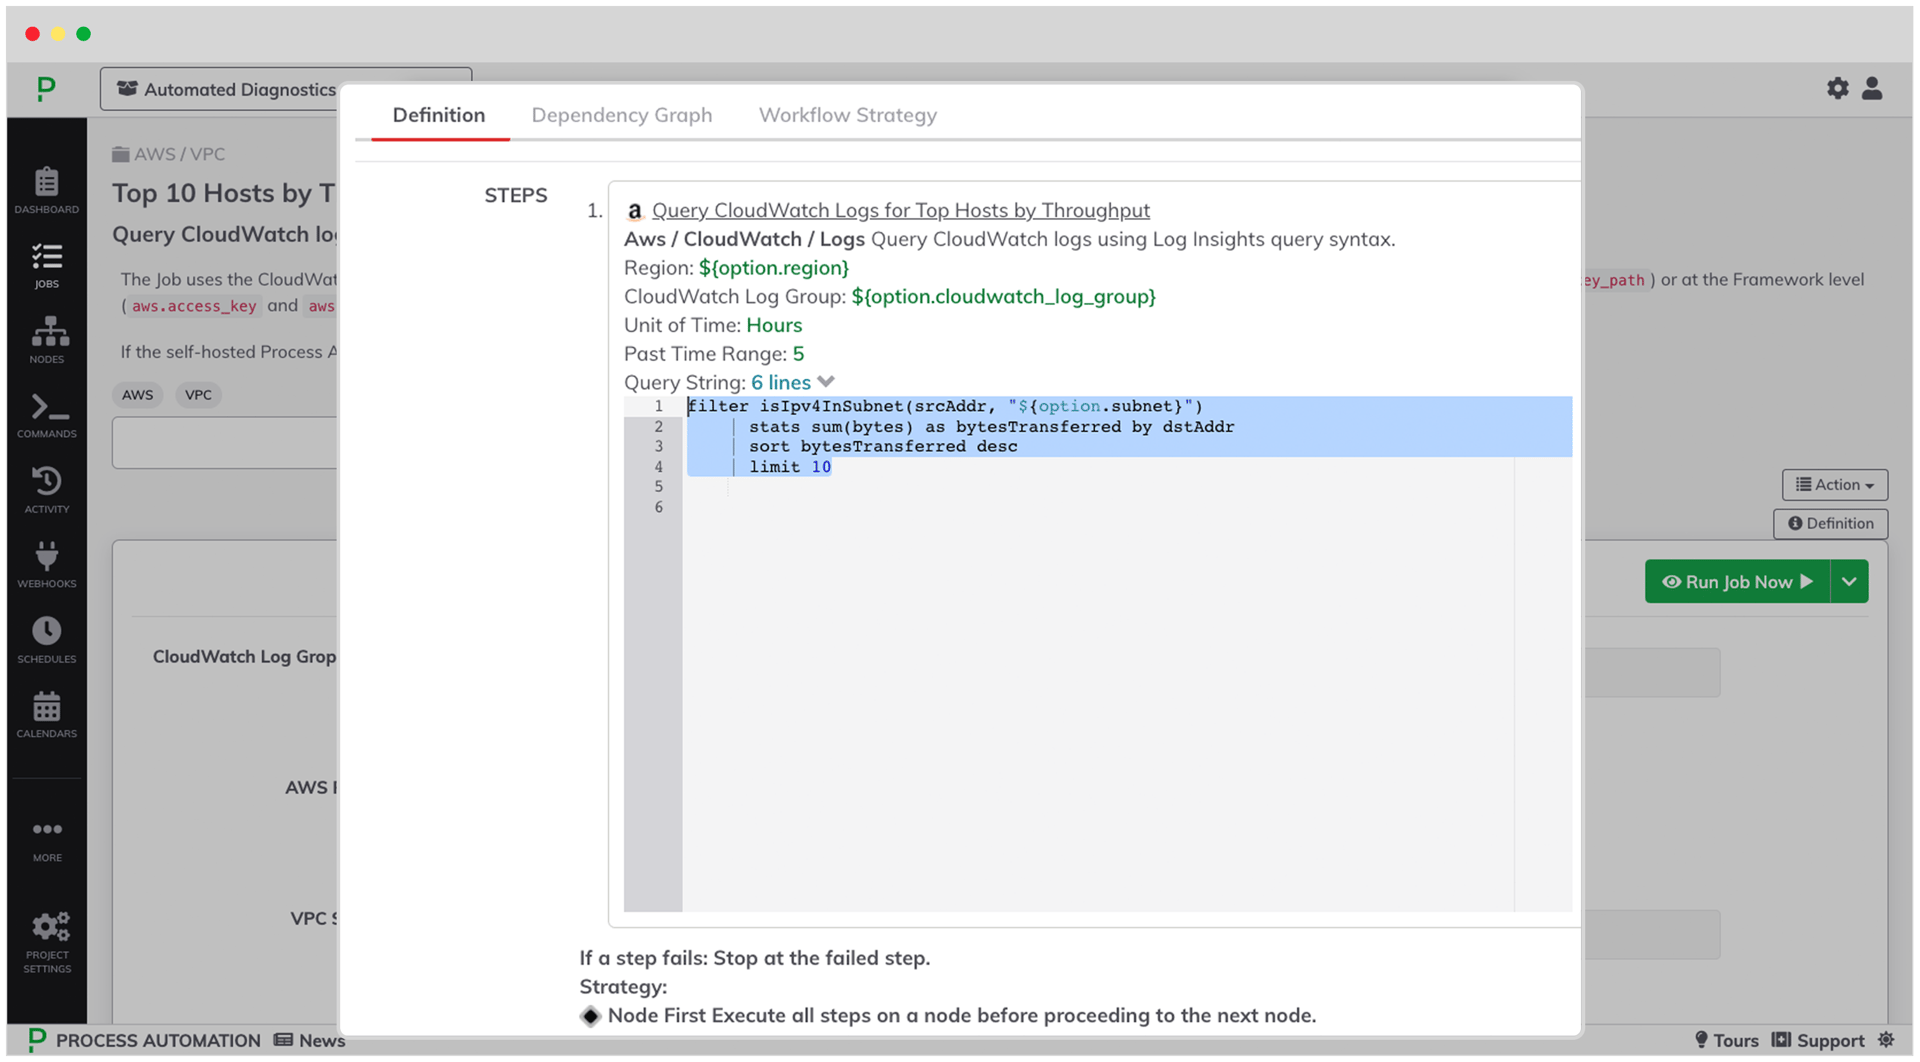
| AWS – VPC | Top 10 Hosts by Throughput on Subnet | Query CloudWatch logs to identify the top 10 hosts by throughput on a given subnet. | CloudWatch Logs |
| AWS – VPC | Top 10 Source IP Addresses with Highest Rejected Requests | Query CloudWatch logs to identify the top 10 source-IP addresses with the highest rejected-requests. | CloudWatch Logs |
| AWS – VPC | Top 10 Web-Server Requestors by Public IP | Query CloudWatch logs to identify the top 10 public-IP requestors to our web-server (e.g. Nginx). | CloudWatch Logs |
And this is just the tip of the iceberg! We will continue to develop and build upon our existing plugins to ensure our customers that use AWS are well-equipped to invoke automation wherever it is needed, including providing some interactive guides.
Want to learn more about common diagnostics? Register for our webinar event, “Common Diagnostics for Common Components,” on September 14th. Request a demo to see automated diagnostics with PagerDuty Process Automation in action.
Already using PageDuty Process Automation? Check out the Automated Diagnostics solution guide to see the end-to-end process of achieving the full solution.