- PagerDuty /
- Blog /
- Automation /
- Automating Common Diagnostics for Kubernetes, Linux, and other Common Components
Blog
Automating Common Diagnostics for Kubernetes, Linux, and other Common Components
by Joseph Mandros
July 27, 2022
| 8 min read
Watch our Automated Diagnostics webinar on demand to learn about common diagnostics for common components and how we provide out-of-the-box job templates for you to get started right away.
This is the second piece in a series about automated diagnostics, a common use case for the PagerDuty Process Automation portfolio.
In the last piece, we talked about the basics around automated diagnostics and how teams can use the solution to reduce escalations to specialists and empower responders to take action faster. In this blog, we’re going to talk about some basic diagnostics examples for components that are most relevant to our users.
But before we jump in, let’s make clear what automated diagnostics isn’t, based on some audience feedback on Twitter from the last article:
- Automated diagnostics is different from alert correlation. Alert correlation depends on a specified depth of signals, as well as an engine that can properly identify said correlated signals. Automated diagnostics is meant to help the first responder triangulate the source of the issue to either fix the issue faster themselves, or escalate more accurately.
- Automated diagnostics is different from monitoring. Monitoring is purpose-built to identify undesired states in performance or activity. This means that most monitoring is not purpose-built to emulate a first-responder’s activities to validate a true positive, or identify the first actions to take. Monitoring is focused on raising the alert. Automated diagnostics is focused on determining how to fix an issue once the alert is already created.
That said, automated diagnostics can certainly make use of data collected by monitoring tools—most people don’t apply thresholds to every datapoint they collect. In fact, one of our more commonly used diagnostics integration is to query CloudWatch logs. While we might consider a log aggregator a monitoring tool, sometimes the first steps of investigation are to look at the data in the monitoring tool that exists purely for diagnosing issues.
Providing responders with on-demand or pre-run diagnostic capabilities for their own environments can help a first responder quickly determine probable cause, thereby pulling in fewer individuals to assist with the incident. By providing first-responders with “diagnostic” data that is typically only retrievable by domain experts, the need to pull in more people for troubleshooting incidents is reduced significantly. This in turn drives down the cost of incidents and reduces mean time to response (MTTR) by automating the investigative steps that are typically manual in nature.
The status quo: Automation in incident response
Operations managers are often excited about the idea of enabling self-healing or auto-remediation. It’s a natural inclination to assume that speeding up resolution through automation means “applying a cure.” But more often than not, the industry theory of “no two incidents are truly identical” rears its head. When you have a high degree of variability, this reduces the value of such potential automation since it’s less likely to be run. For example, restarting a core service may be the right way to fix today’s issue, but it could lead to a cascading failure—and an even bigger incident—tomorrow.
*The reader now switches cognitive gears to the initial stages of a response.*
But you know what tends to be highly repetitive? The same investigative steps a responder takes to begin to diagnose what went wrong and determine what happened. More repetitive action means more value to gain from applying automation. For example, let’s say an incident kicks off within your Kubernetes distribution. No matter the nature of the incident, whether it be something within your image repository, or load balancer, you’re likely still going to take the same diagnostic step of pulling your kubernetes logs.
These diagnostic steps often remain static—for the most part—depending on the component you’re working with, no matter the priority of the incident that occurs. Automated diagnostics can be applicable to heterogeneous incidents; it doesn’t have to be purpose-built for the same, recurring incident, it can be applied to and customized around all sorts of common incident types and severities—specific to your environment—for almost any common component. Think of it like going to the doctor’s office. Whether you are going to urgent care for a specific complaint or just an annual checkup, they still take your temperature, blood pressure, and weight when you walk in.
Common Examples
Every developer environment is different; but many environments are also quite similar once you really pop the hood. In the beginning stages of a response, most diagnostics will come from three main data sources:
- Application data
- System data
- Environment data
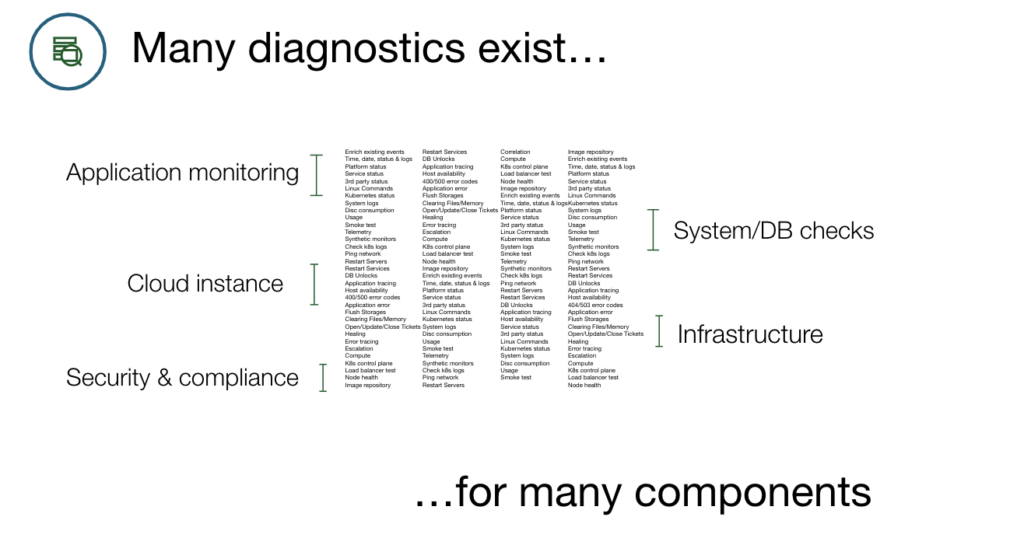
There are several examples of common diagnostics and components that can be automatically pulled during the beginning of a response. This would not only help the responder better understand the severity of the incident, but will also help ensure the responder doesn’t pull in too many specialists and interrupt them from their normal day of work. For example, let’s look at Kubernetes (k8s) as a component for a responder during an incident. When an incident happens within a k8s environment, the infrastructure engineer who maintains the technology would typically perform actions such as:
- Tail logs from k8s pod
- Retrieve logs from k8s by selector label
- Check image repo
- Describe deployment
- Execute command in pod
One thing all of these actions have in common? A typical L1 responder ACK’ing an incident doesn’t know how to orchestrate these actions—it’s just not their area of expertise. But with the out-of-the-box jobs from PagerDury’s Automated Diagnostics, the L1 responder can automatically run these diagnostics and execute these jobs, which speeds up the response and reduces the escalation to the infrastructure engineer responsible for the k8s environment.
Some common diagnostics and alert examples include:
- CPU/Memory Consuming Services
- Common alert: High CPU/Memory
- Common question: Which service(s) are consuming CPU/Memory?
- File size / Disk Consumption
- Common alert: High CPU/Memory
- Common question: Which files/directories are consuming the most space?
- System Logs: Linux/Windows Commands
- Common alert: Server/service issues
- Common question: Is it an OS issue or app issue?
- SQL Database Commands
- Common alert: Database blocks/deadlocks
- Common question: Is there a long-running query blocking other database requests?
- Host Availability
- Common alert: Host down
- Common question: Is it actually down or is it a false-positive reachability issue?
- Application Error: Application Logs or traces
- Common alert: 400/500 error codes
- Common question: What is the stack-trace?
A few examples of some common diagnostics for known components:
- Cloudwatch Logs: Surface specific application and VPC logs.
- ECS: View stopped ECS task errors.
- ELB: Debug unavailable target-group instances.
- Kubernetes. Retrieve logs from Pods by selector label.
- Linux. Retrieve service status.
- Nginx. Retrieve error logs.
- Redis. Slow log entries.
And these are just some of the over 30 out-of-the-box jobs templates we have built for our users that you can find in the Automated Diagnostics solution guide. To use the Automated Diagnostics Solution, you must either have a PagerDuty Runbook Automation license or a Process Automation (previously Rundeck Enterprise) license. See the FAQ for details on how to use. If you do not have a license for either of these products, contact us to learn more.
Automating diagnostics within PagerDuty
Incidents that notify responders are filled with information provided by monitoring tools that have a “miopic” view on the alert(s). A common example is that high CPU usage triggers an alert, and this notifies a responder. But the information contained in the alert is surface-level in that it does not specify what might be the cause of the spiked CPU.
Diagnostic data is the deeper-level information that helps answer the “why” and “where” questions of incidents. Even though some monitoring and correlation tools provide some help in providing root-cause analysis for users, most fall short in their ability to emulate a responder’s investigative/troubleshooting steps of collating disparate data-sources into a unified view. By providing responders with on-demand or pre-run diagnostic capabilities, the odds of the first responder resolving the issue on their own increase, as well as the probability of pulling in fewer individuals to assist with the incident. Enter Automated Diagnostics.
Want to learn more about common diagnostics for the components you use? Register for our September 14th webinar event of the same name, hosted by Justyn Roberts, Senior Solutions Consultant, PagerDuty. New to PagerDuty Runbook Automation? Request a demo. Already using PagerDuty Runbook Automation? Check out the automated diagnostics solution guide to see the end-to-end process of achieving the full solution.