- PagerDuty /
- Blog /
- Announcements /
- PagerDuty 2.0
Blog
PagerDuty 2.0
We’re happy to announce we’ve released the new version of PagerDuty, which has multi-incident support. To try it out, just log into your PagerDuty account.
This new feature corrects an over-simplification in PagerDuty’s design: up to now, PD required you to create a new alarm for each type of problem that your monitoring systems are capable of detecting. Unfortunately, this doesn’t work very well if you’re using a monitoring tool like Nagios, which can monitor thousands of hosts and services at once. The new release can now handle multiple open incidents from a single monitoring system; we call this “multi-incident support”.
Here’s a quick summary of the changes in the new release:
- Alarms have been renamed to Services.
- Alarm Groups have been renamed to Escalation Policies.
- Services can now track multiple open incidents at once.
- Incident “suppression” has been renamed to “acknowledgement”.
- The amount of time an incident stays Acknowledged is now configurable on a service-by-service basis
The new version of PD is 100% backwards compatible with the previous version. Yes, we’ve renamed a bunch of stuff, but we’ve been very careful to retain the same behavior as the old version for your existing services. Read on for more details.
The big change: Multi-Incident Support
PagerDuty is now capable of tracking multiple open concurrent incidents. Put another way, your monitoring system can tell PagerDuty about 100 simultaneous and independent problems without you needing to create 100 PagerDuty alarms (as was the case in the old version of PD).
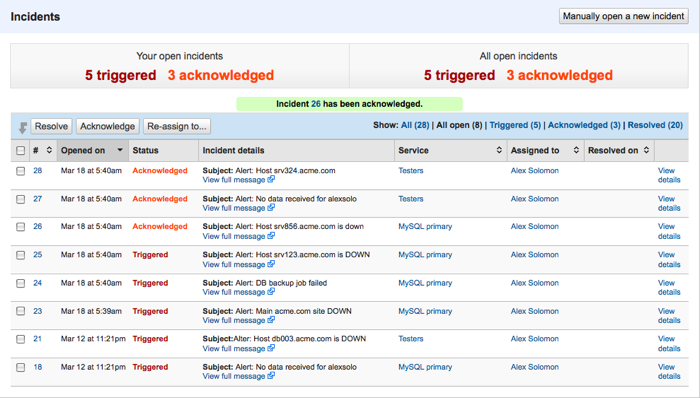
PagerDuty now uses “incidents” rather than “alarms” as the main object. Your support team will be acknowledging, escalating, and resolving incidents, instead of alarms. Incidents in PagerDuty are similar to tickets in a bug tracking system: they are created when a problem is detected, and are resolved or closed when the problem is fixed.
Since PagerDuty can now handle hundreds of open incidents at once, we’ve tried to carefully design PagerDuty’s interface to make it easy to work with large collections of incidents. The new Incidents and Dashboard tabs feature tables that let you see all of the open incidents assigned to you at a glance. You can also easily triage your incidents straight from these pages using the controls located at the top of the table.
Turning on multi-incident support for your PagerDuty services
By default, the PagerDuty services still work the same way they’ve always worked: they can only have one incident open at once. The reason for this is to maintain backwards compatibility.
You can enable multi-incident support for any existing service. Here’s how:
- Click on the “Services” tab, and click the “Edit” link (under Actions) for the service you wish to modify.
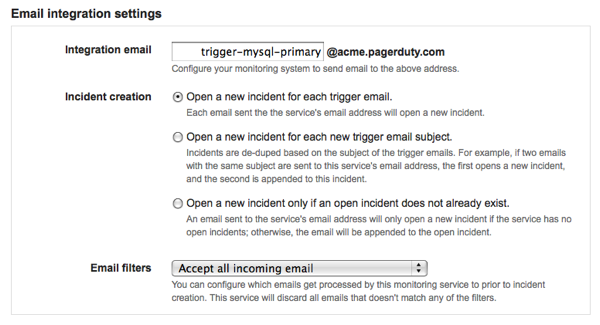
- Under the “Email integration settings” section, you’ll see 3 options:
- Open a new incident for each trigger email
- Open a new incident for each new trigger email subject
- Open a new incident only if an open incident does not already exist

The first option, if selected, will cause the service to open a new incident for each trigger email sent to the service’s email address.The second option, if selected, will cause the service to open a new incident based on the email subject: if an open incident with the same subject already exists, the email is appended to this incident; if not, a new incident is created.
The third option, which should be selected by default for an existing service, allows a service to maintain the behavior of the old version of PagerDuty. It basically turns multi-incident support off: if selected, the service can only have one open incident at any one time. When the service receives a trigger eamil, it opens a new incident if the service doesn’t already have an open incident; otherwise, it appends the email to the open incident.
- To turn multi-incident support on, select either the first or second option.
- Click “Save changes” at the bottom of the page, and you’re done.
Alarms are now Services
We’ve renamed “alarms” to “services”. Services are now used only to represent an integration point between PagerDuty and your monitoring services. Currently, the PagerDuty services integrate with your monitoring systems via email integration (just like in the old version of PD). In the coming weeks, we will also add support for an HTTP-based API for the PagerDuty services. This will allow your monitoring systems to trigger/acknowledge/resolve incidents in PagerDuty via a synchronous API call.
For similar reasons, we’ve renamed “alarm groups” to “escalation policies”. We think the new name better captures the use of these objects.
Incident “suppression” is now incident “acknowledgement”
We’ve also renamed incident “suppression” to “acknowledge”. As before, this feature is used to temporarily prevent an incident from generating alerts. We thought the word “acknowledge” better captured the purpose of the feature: “stop bothering me about this problem for now… I’m working on it!”.
We’ve also made the acknowledgement timeout configurable on a service-by-service basis. This means that you can set the amount of time that an incident stays in the Acknowledged state, before it reverts to back to Triggered and alerts you again. The timeout is set to 30 minutes by default for each service, but you can change it or even turn it off easily:
- Click on the “Services” tab, and click the “Edit” link (under Actions) for the service you wish to modify.
- Under the “Incident settings” section, you’ll see an entry for the “Incident ack timeout”.
- By default, the timeout is set to “30 minutes”. To modify the timeout, click and change the value of this drop-down.You can also disable the timeout altogether, by unchecking the checkbox labeled “Enable a timeout for incidents left in the Acknowledged state for too long”. We recommend leaving the timeout enabled, to ensure you don’t forget incidents in the Acknowledged state.
- Click “Save changes” at the bottom of the page, and you’re done.
What’s next?
Next up is support for a PagerDuty API. This will make it easier to integrate PagerDuty with popular monitoring tools like Nagios, Zenoss, monit, Munin and many others. The API will allow your monitoring system to trigger, acknowledge and resolve incidents directly in PagerDuty, via a synchronous call to the API.


