Who watches the watchmen?
How we drink our own champagne (and do monitoring at PagerDuty)
We deliver over 4 Million alerts each month, and companies count on us to let them know when they have outages. So, who watches the watchmen? Arup Chakrabarti, PagerDuty’s engineering manager, spoke about how we monitor our own systems at DevOps Days Chicago earlier this month. Here are some highlights from his talk about the monitoring tools and philosophies we use here at PagerDuty.
Use the right tool
When it comes to tools, New Relic is one of the tools we use, because it can provide lots of graphs and reports. Application performance management tools give you a lot of information, which is helpful when you don’t really know what your critical metrics are. But they can be hard to customize, and all that information can result in “analysis paralysis.”
PagerDuty also uses StatsD and DataDog monitor key metrics, because they’re easy to use and very customizable, though it can take a little time (we did a half-day session with our engineers) to get teams up to speed on the metrics. SumoLogic analyzes critical app logs, and PagerDuty engineers set up alerts on patterns in the logs. Wormly and Monitis provide external monitoring, though the team did have to build out a smarter health check page that alerts on unexpected values. And, finally, PagerDuty uses PagerDuty to consolidate alerts from all of these monitoring systems and notify us when things go wrong.
Avoid single-host monitoring for distributed systems
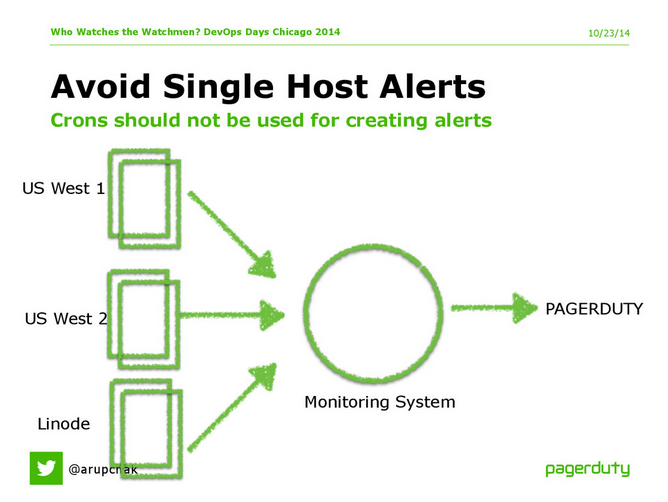
“Assume that anything that’s running on a single box is brittle and will break at the most inopportune time,” says Chakrabarti. Rather, PagerDuty sets up alerts on cluster-level metrics, such as the overall number of 500 errors, not the number in a single log file, and overall latency, not one box’s latency. For this reason, PagerDuty tries to funnel all of their systems through the monitoring system rather than feeding data directly from the servers or services into PagerDuty.

We funnel server and service alerts through a highly-available monitoring system so that we alert on the overall impact rather than individual box issues.
Chakrabarti also discusses dependency monitoring, or how to monitor the performance of SaaS systems that you don’t control. There’s no great answer for this problem yet. We do a combination of manual checks and automated pings. As an example, he tells the story of getting a call from a customer who wasn’t getting their SMSes. Upon investigation, it turned out that our SMS provider was sending the messages, but for some reason the wireless carrier was blocking them. As a result, we built out a testing framework, “a.k.a. how to abuse unlimited messaging plans.” Every minute, we send an SMS alert to every major carrier, and measure the response times.

We send SMS messages to the major mobile carriers every minute and measure the response times to make sure we know if the carriers are experiencing issues that may be affecting the deliverability of our SMS alerts
Alert on what customers care about
A lot of people make the mistake of alerting on every single thing that’s wrong in the log, Chakrabarti says. “If the customer doesn’t notice it, maybe it doesn’t need to be alerted on.” But, he warns, the word “customer” can mean different things within the same organization. “If you’re working on end-user things, you’re going to want to monitor on latency. If you’re worried more about internal operations, you might care about the CPU in your Cassandra cluster because you know that’ll affect your other engineering teams.” We have a great blog post on what to alert on if you want to learn more.
Validate that the alerts work
Perhaps the best example of watching the watchers is the fact that “every now and then, you might have to go in manually and check that your alerts are still working,” says Chakrabarti. “We have something at PagerDuty we call Failure Friday, when basically we go in and attack our own services.” The team leaves all the alerts up and running, and proceeds to break processes, the network, and the data centers, with the intent of validating the alerts.
What has the team learned from Failure Friday? “Process monitoring was co-mingled with process running,” Chakrabarti explains. “If the service dies, the monitoring of the service also dies, and you never find out about it until it dies on every single box.” And that, in short, is the reason for external monitoring.


