
- PagerDuty /
- Blog /
- ITOps & Modern Ops /
- True Full-Stack Visibility Into Your Modern Day Infrastructure
Blog
True Full-Stack Visibility Into Your Modern Day Infrastructure
by Vera Chan
January 31, 2017
| 4 min read
What is Full-Stack Visibility?
You often hear that a tool provides full-stack visibility — but what exactly does that mean? Different tools provide visibility in different ways, since visibility not only depends on how your IT infrastructure is composed, but what it is you want visibility into. Ultimately though, full-stack visibility provides you a look into your tools, applications, systems, services, and overall infrastructure.
Modern Infrastructure
First, let’s try to identify what type of full-stack infrastructure would host modern day applications and services. Below are the most common critical components that are found in a modern day infrastructure. These may exist as a mix of virtual and physical devices hosted on-premises, in the cloud, or in a hybrid environment.
Application & Tools
Middleware
Database
Web Servers
Middleware
Database
Web Servers
Operating Systems
Network
Storage
Compute
Network
Storage
Compute
All these infrastructure components generate a tremendous amount of both structured and unstructured data. The exponential growth in volume and diversity of this data challenges ITOps, DevOps and development teams to try and interpret and extract information and actionable insights that are critical in keeping systems, applications, and services highly available and performing optimally.
The following are examples of tools that organizations today adopt to help automate their infrastructure and application performance. Each one of these tools can generate data informing you of the status, health, and vulnerability of your infrastructure, apps, services, code deployments, builds, and more.
Automation / Continuous Integration Collaboration
Configuration Management & Provisioning
Source Code & Repository Management
Deployment
Database
Monitoring
Build
Logging
Configuration Management & Provisioning
Source Code & Repository Management
Deployment
Database
Monitoring
Build
Logging
Source Code Management
Repository Management
Provisioning
Release Management
Testing
Security
Cloud IAAS
Networking & Content Delivery Network
Microservices and Virtualization
Repository Management
Provisioning
Release Management
Testing
Security
Cloud IAAS
Networking & Content Delivery Network
Microservices and Virtualization
What Kind of Visibility?
Visibility into applications, services, and systems, come in various forms: data tables, status dashboards, performance graphs and charts, heat maps, tracing, system health metrics, analytics, reports — the list goes on. Full-stack visibility can be comprised of a combination of tools.
| Monitoring Tool Category | Popular Vendors |
| Application Performance Monitoring | New Relic, AppDynamics. Dynatrace |
| Infrastructure / Cloud Monitoring | AWS CloudWatch, Microsoft Azure, Google Stackdriver |
| Metrics | Datadog, Librato, Keen IO |
| Log Monitoring & Analytics | Splunk, Elastic, Sumo Logic |
Organizations have already started using a variety of the above solutions to build out their IT tools portfolio in order to better understand what’s going on across their infrastructure.
Solutions like PagerDuty are leveraged by organizations to centralize and aggregate all the events and alerts that are generated from all the tools in the IT portfolio, to triage and orchestrate better response to incidents in real-time.
There is a wealth of tooling that show you what’s going on and most teams have invested in multiple monitoring and ticketing solutions. What’s more important is a solution that delivers the context you need to better interpret what’s actionable or informational and arms experts with the resources to restore services and prevent major incidents from impacting the business.
Going Beyond
Here at PagerDuty, our belief is that true full-stack visibility doesn’t just include a view into the health of infrastructure, applications, and services. It includes other critical parts, such as incident management, response orchestration, and visualizations both system and operational efficiency, so teams can continuously improve on SLAs. As software becomes the center of the business and customer experience, ITOps, DevOps, developers, IT leadership, executives, and business stakeholders all need greater visibility into what goes on across the infrastructure.
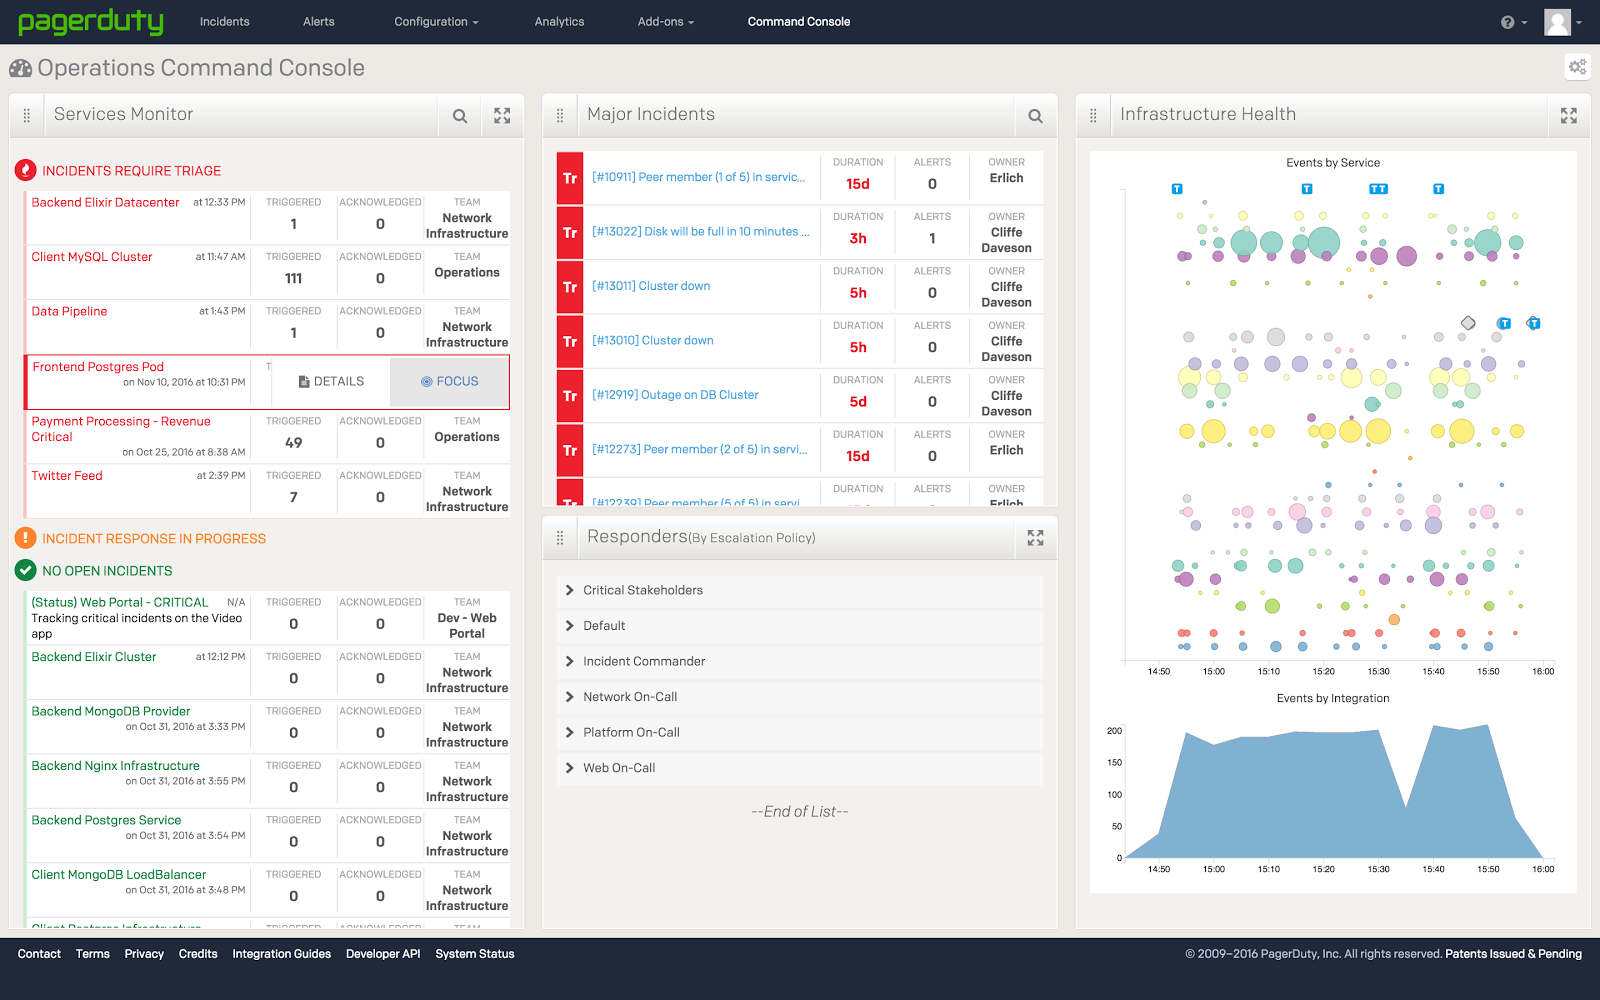 You can’t forget the importance of people when it comes to assessing the true health of your infrastructure. Tools will always do their job, but incidents are resolved by people that understand the data from those tools. PagerDuty’s Operational Command Console and Intelligence Applications bring these contexts from numerous vendors into a single view, providing a comprehensive look at which critical incidents are outstanding, which responders are currently working on incidents, which events are correlated, and much more in order to coordinate and orchestrate both technical and business response to incidents. PagerDuty makes it easy to visualize the health of applications, services, and infrastructure while managing incident response workflows all in one place.
Interested in trying out the latest capabilities from PagerDuty? Sign up for a free trial today or register for our weekly demos!

