- PagerDuty /
- Blog /
- Announcements /
- New Reporting Feature: Who Ever Said Numbers Were Boring?
Blog
New Reporting Feature: Who Ever Said Numbers Were Boring?

When we aren’t dealing with event storms and cloud outages, we’re working hard on improving our product for you. One such effort has been to let you use more of the wealth of information we store for your account. We already keep track of every incident you’ve ever sent us, every phone call we’ve ever sent you, and every SMS message that ever woke you up. As it turns out, if we improve the navigability and visibility of that information it can tell some interesting stories.
In the past, our Reporting tab on your PagerDuty account read more like a phone bill than a report. You could see the total number of alerts sent for a given month, and get a specific list of phone calls made or emails sent for that month. That was about it.
Sure, you can still do that. But you can now do a lot more.
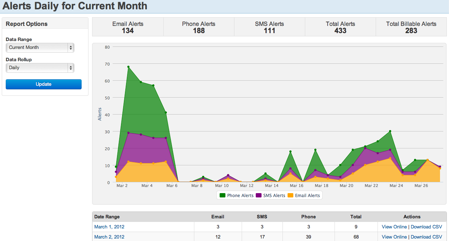
You can now get a high level view of how your operations are trending over time. Are you getting better at it? Worse? What weeks last year were totally abysmal? Do your employees get a case of the Mondays after being hounded by operational issues? Are your weekends and holidays generally light on headaches and nice to your Ops Engineers? What was the all-time worst day for operations last year? You can now answer these questions quickly and relatively easily by visualizing the data in PagerDuty. Just tune your date range with some of our default date-ranges, or use your own. Change your data granularity by setting the data rollup and you’re off to the races.
Once you’ve found the data you care about, you can drilldown to get specific details about what alerts were firing or what incidents were causing them for a particular time range. Once you’ve drilled down, you can further refine your time range query to locate operational problems. Maybe you’ll be able to correlate events you never realized were related.
If the new reporting interface doesn’t provide you all of the data slicing you need, you can always export the data to CSV, open it up in Excel and perform further ninja operations on your numbers.
Regardless, we’re just getting started and we’ve barely scratched the surface on things we can do. We have lots more ideas on where we can go from here. What do YOU want to see?


