- PagerDuty /
- Engineering Blog /
- Actionable Kanban Team Metrics: The What, Why, and How
Engineering Blog
Actionable Kanban Team Metrics: The What, Why, and How
by Derek Ralston
February 18, 2020
| 6 min read
As an Agile Coach at PagerDuty, one aspect of my job is to help teams refresh their processes when they’re no longer working for them. In the case of one high-performing kanban team I was coaching, there was a noticeable shift in energy in the (virtual) room when we went over their kanban metrics during our bi-weekly team retrospective. With eyes glazed over, folks were either multitasking or only paying attention if their ticket was called out. It wasn’t that the team was disinterested in their kanban metrics; they had just lost sight of the “why” behind the metrics and stopped taking action to improve them. Spoiler alert: This blog post covers the same tips I gave the high-performing team to refresh their processes and make their kanban metrics actionable.
To ensure we were still making good use of everyone’s time when we reviewed the metrics during team retrospectives, I set out to better clarify the “why” behind these metrics and introduce potential actions the team could take based on what they saw. My hope was that, by clarifying the “why,” the team would see the value in their kanban metrics and also remember the questions to ask themselves (even when I wasn’t around to facilitate their retrospective).
In this blog, I write about the tips that I shared with our high-performing team so that you can also make your kanban metrics actionable.
- What the most important kanban metrics are
- Why we look at those particular metrics
- What to look for in the data
- How an empowered team can take actions based on what the numbers tell them
Metric #1: Cycle Time
Cycle time measures how much time a task spends going through the team’s process. Cycle time starts being measured as soon as the team member starts the work. For most teams, this means pulling a task over to an In Progress state and beginning the work.

On this team’s Kanban board, the clock starts for cycle time when the work is pulled to an In Progress state and ends when the work is categorized as Done.
Why Do We Look at It?
“What gets measured, gets managed” is a famous quote by management author Peter Drucker. Cycle time is important because it measures how long it will take your team to deliver on a task. By looking at average cycle time as a team, we can manage the flow of our work, identify potential bottlenecks, and take necessary action.
What Are We Looking For?
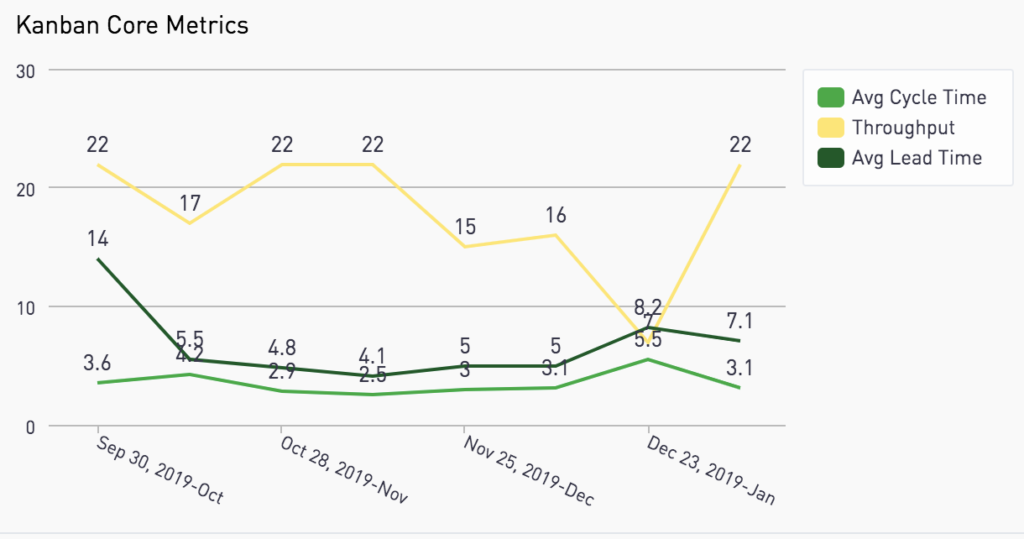
How is the team’s average cycle time trending over the last four iterations? How significant is the variance of cycle time between iterations?
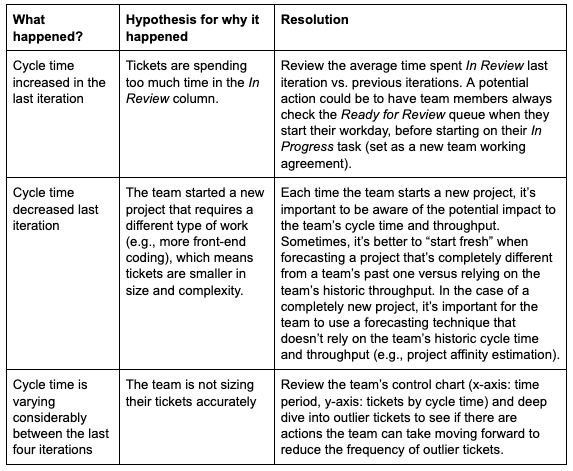
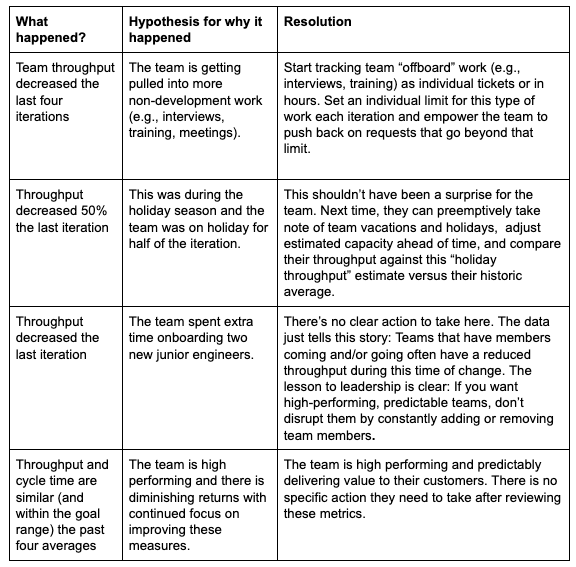
How Can We Take Action After Reviewing Our Cycle Time?
Metric #2: Throughput
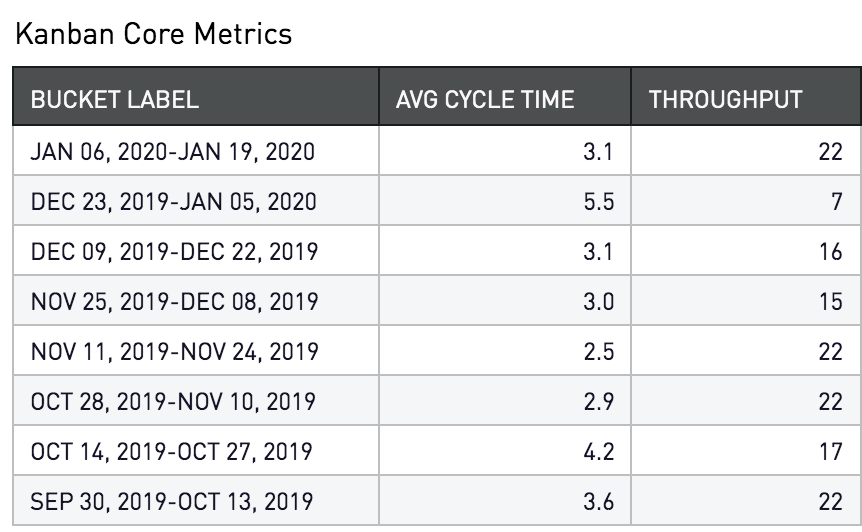
While cycle time is focused on how long it takes for a single task to go through the team’s process, throughput measures how many tasks were delivered within a certain time period. Throughput is focused on Completed tasks only. It’s important to note that In Progress work does not get counted in this metric.
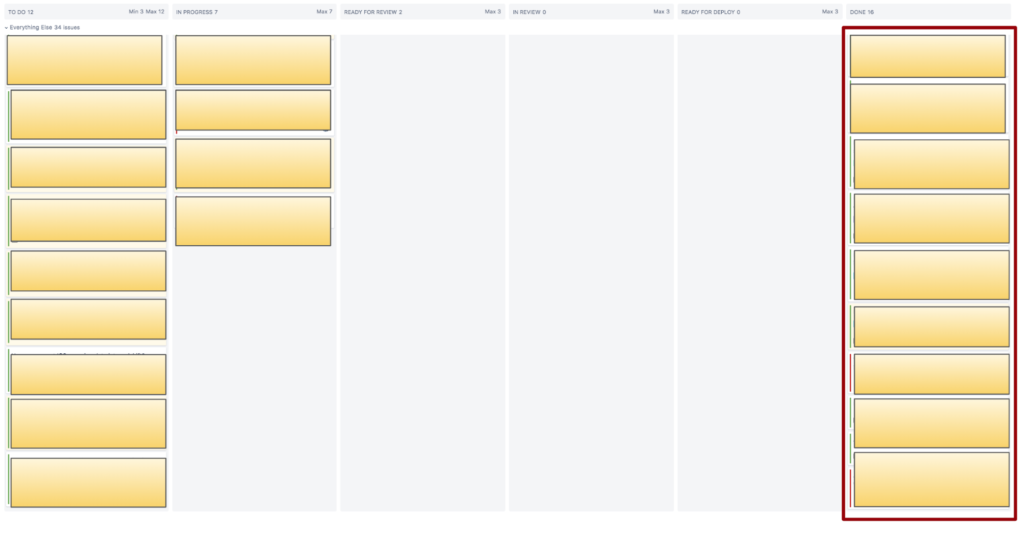
At the end of an iteration, only the tickets in the Done column will get counted towards the team’s throughput.
Why Do We Look at It?
Like cycle time, throughput helps us better manage the flow of work through the team’s process. By focusing on improving (or maintaining for an already high-performing team) throughput, we can ensure predictable delivery of value to our customers.
What Are We Looking For?
How is throughput trending over the last four iterations? How significant is the variance of throughput between these iterations?
How Can We Take Action After Reviewing Our Throughput?
Distilling Meaningful Insights From Kanban Metrics
Tracking team cycle time and throughput is important, but that’s not enough. You need the right lens through which to view these metrics in order to make meaningful insights.
Visual 1: Control Chart
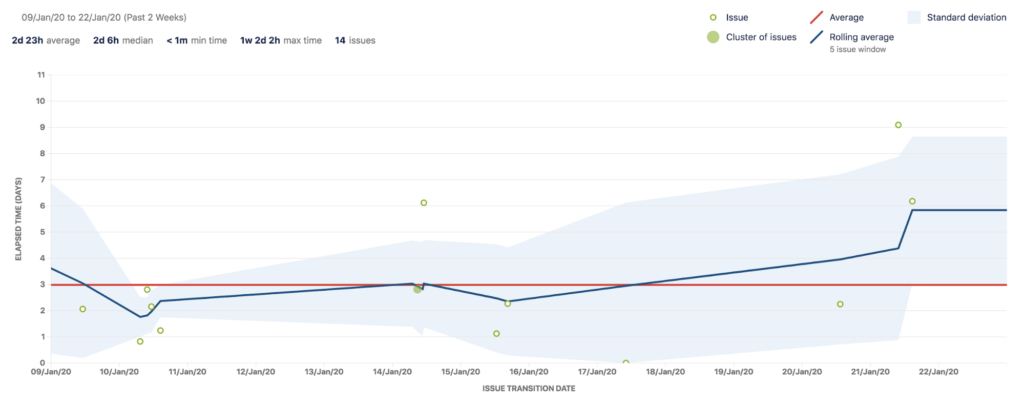
A control chart is a graph used to see how a process changes over time. Task data is plotted over time (x axis) and cycle time (y axis). The average and standard deviation are also plotted on the control chart. During a team retrospective, the team will look at the top 2-3 outlier tickets on the control chart and deep dive into why the ticket took so much longer than the average. From there, they will make a hypothesis and potentially take a necessary action to reduce cycle time for similar tasks in the future. Some teams also examine this chart over a longer period of time with the goal of reducing standard deviation (the blue region of the chart).
Note: It’s important that an individual team member doesn’t feel called out and that the entire team is held accountable for outlier tickets. At PagerDuty, we have a blameless culture where the team’s focus is on “what can we do different, as a team, next time” versus focusing on blaming a single team member or finger pointing.
Visual 2: Capacity Allocation Chart
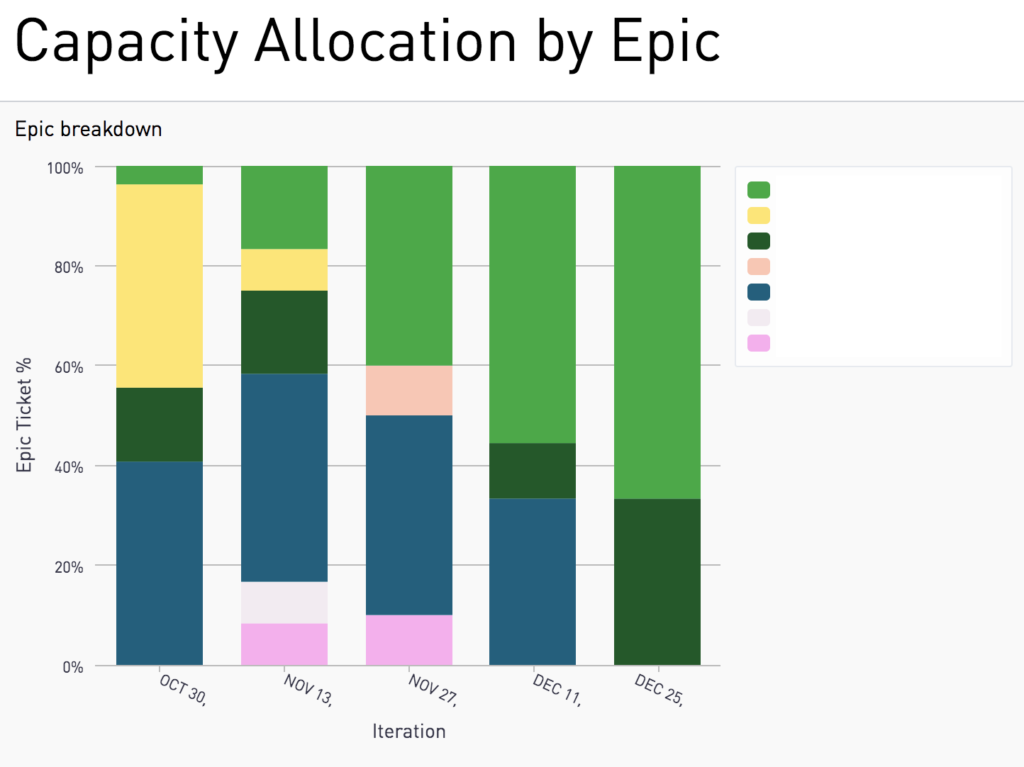
A team capacity allocation chart shows what the team is focused on within each iteration. You can visualize team capacity by project (e.g., tickets linked to an epic) or by ticket type (e.g., task vs. bug). Reviewing team capacity allocation is important as it helps the team see where they are focusing their efforts, if they are spread too thin, and if there is an appropriate mix of feature work and engineering work.
“What Gets Measured, Gets Managed.”
As you can see, both cycle time and throughput are important metrics for kanban teams to look at on a regular basis, as well as the team’s control chart and capacity allocation chart. But without a deeper understanding of the “why” behind them and “how” to take action on them, they are nothing more than pretty graphs the team looks at every few weeks. I hope this blog post will help you reflect on your team’s effective use of kanban metrics and ways that you can make them more actionable.
Do you have any lessons learned or stories to share around your team’s use of metrics? Share them on our Community page to let us know what works best for your team.