
- PagerDuty /
- Engineering Blog /
- Tracking Down an ETS-Related Memory Leak
Engineering Blog
Tracking Down an ETS-Related Memory Leak
by Tyler Pachal
November 19, 2019
| 8 min read
ETS will hold references to large binaries, even if just part of the original binary is stored in a table. Copy binaries if pieces of them are going to be kept around for a long time.
I was creating a new Elixir application that was part of a larger micro service. It was responsible for consuming messages from Kafka, decoding the payloads, plucking two fields from the payload, and storing those fields in an ETS table. Disregarding the boilerplate and error handling, the code looked like this:
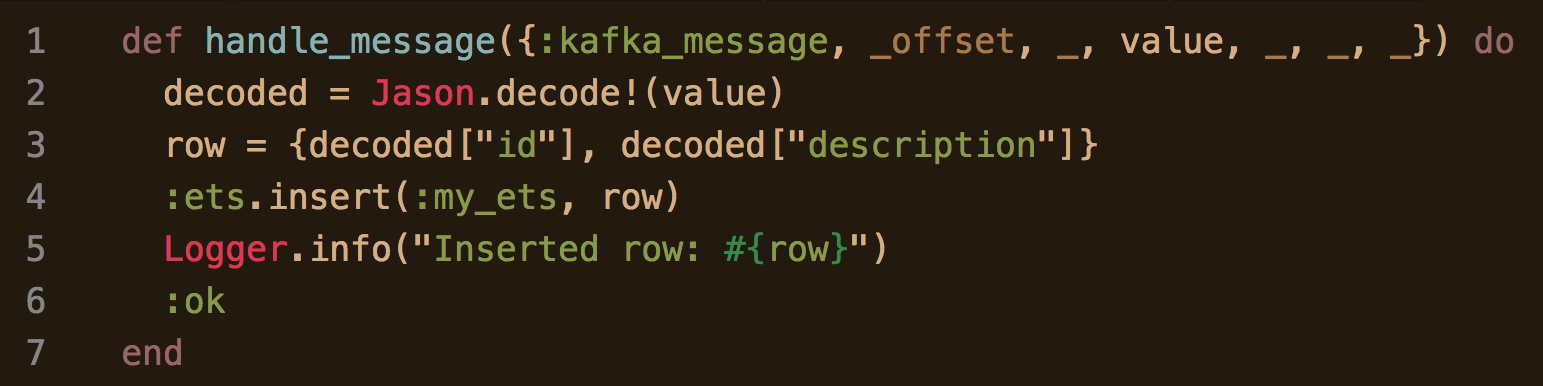
A callback which eventually gets call by Brod to handle Kafka messages. Looks simple, but there is a memory leak here!
I ran the code locally, wrote some unit tests, and everything worked as expected. There were no signs of any problems until I deployed the code to production and gave it some shadow traffic to test it out with load for the first time:
DataDog: memory consumption is very high
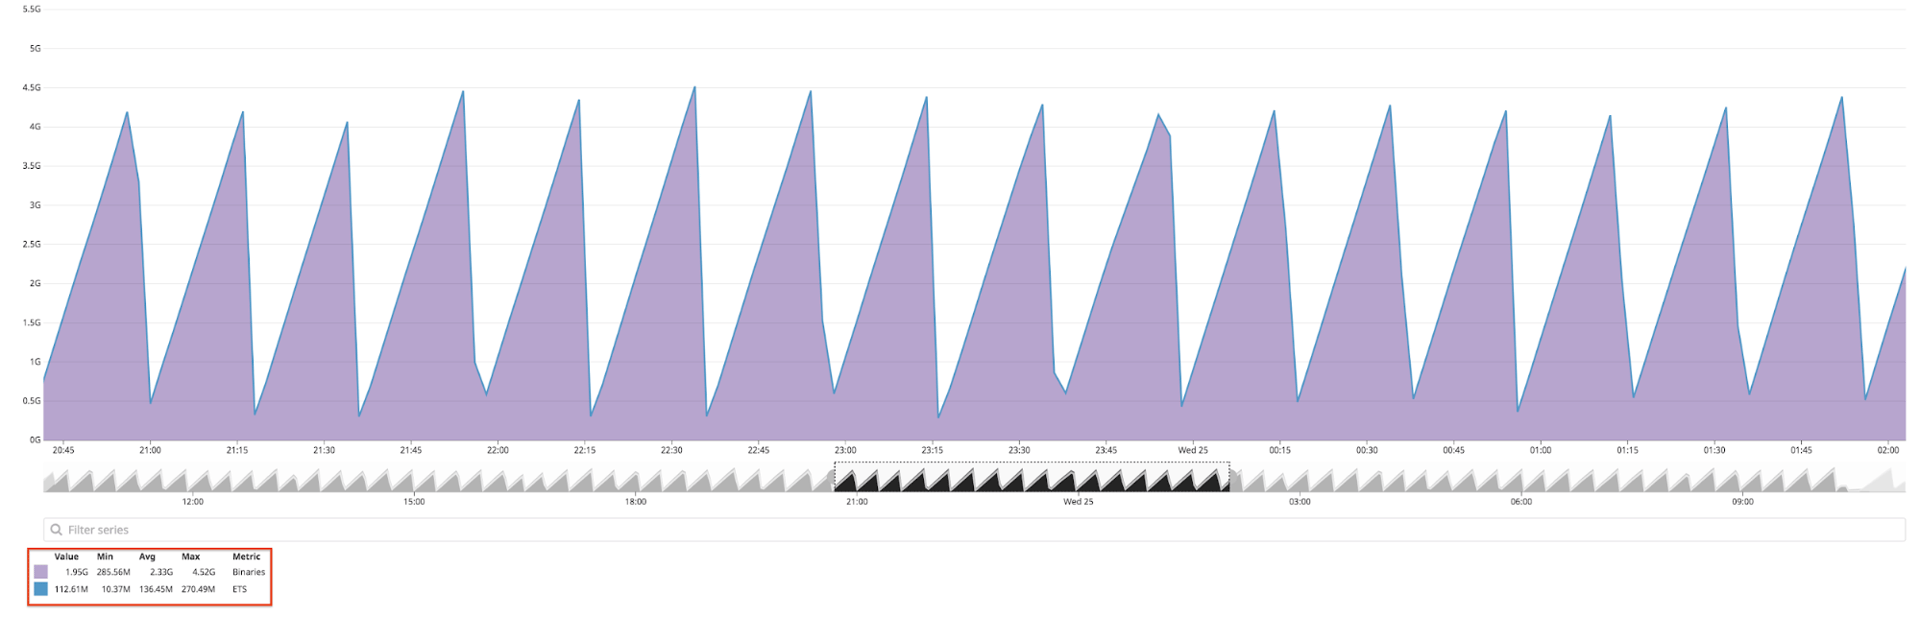
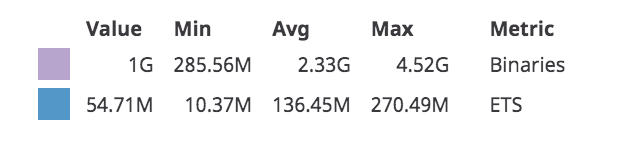
Yikes! Each time the service started, the memory would rise very quickly, until the service was killed/restarted by the container orchestrator for using too much memory. If we zoom in on the legend, we can see that the purple area represents memory being used by Binaries, while the blue area representing ETS is using comparability little memory:
Datadog: Most memory being using by Binaries, not ETS
That data is provided by periodically calling :erlang.memory/0 which gives you information about how memory is being used by the VM, broken down by the memory type. Here is an example of using IEx to call it locally:
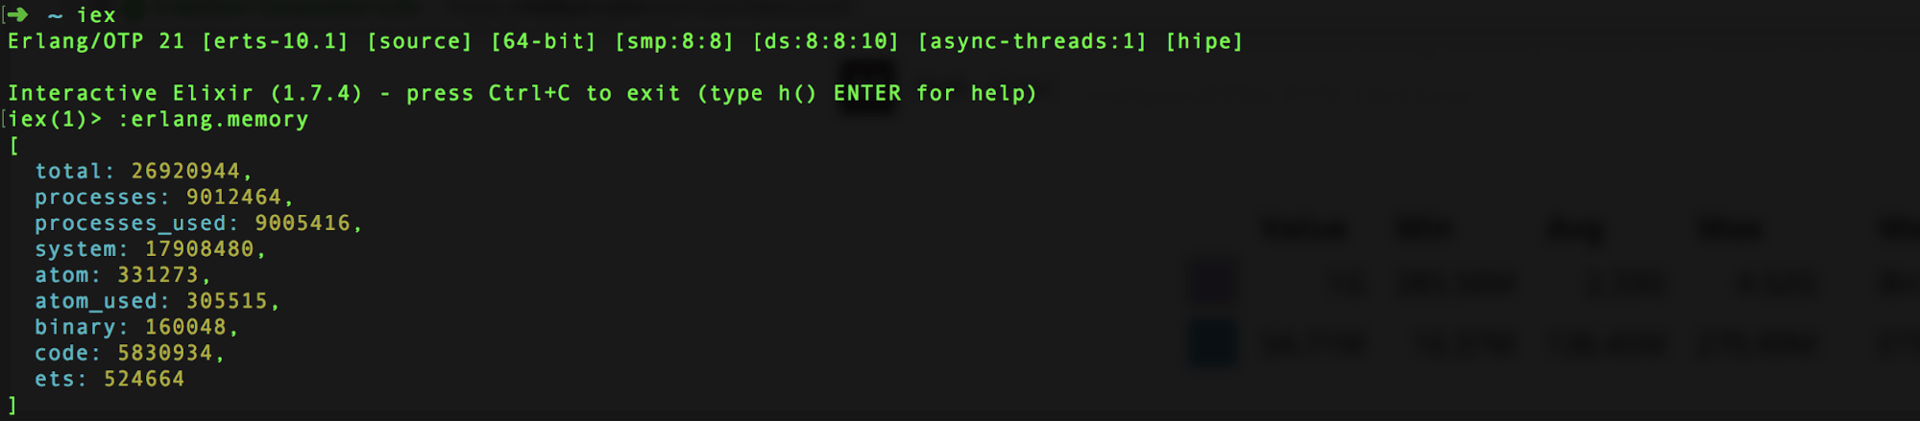
Example of :erlang.memory/0 in action
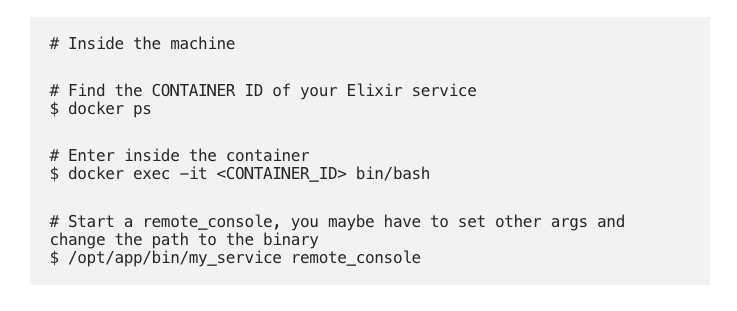
The next step was to connect to my service and examine things from the inside. Depending on how you create and run your releases this step will be different, but being able to connect to a running service is a must-have in my opinion. In this particular case, the release was built with Distillery and run inside a Docker container:
Once we are attached to our Elixir service, we can use some helpful libraries to debug:
:observer_cli— gives you the same info as:observerbut in textual form, which is great for instances like this when we don’t have a GUI:recon— helper functions and scripts that are specifically meant for use in production environments
First I wanted to get a picture of which processes were using the most memory, just to make sure that it was indeed the Kafka-related stuff that I had added. To do that, I used the :observer_cli and ordered all of the processes by their memory usage:
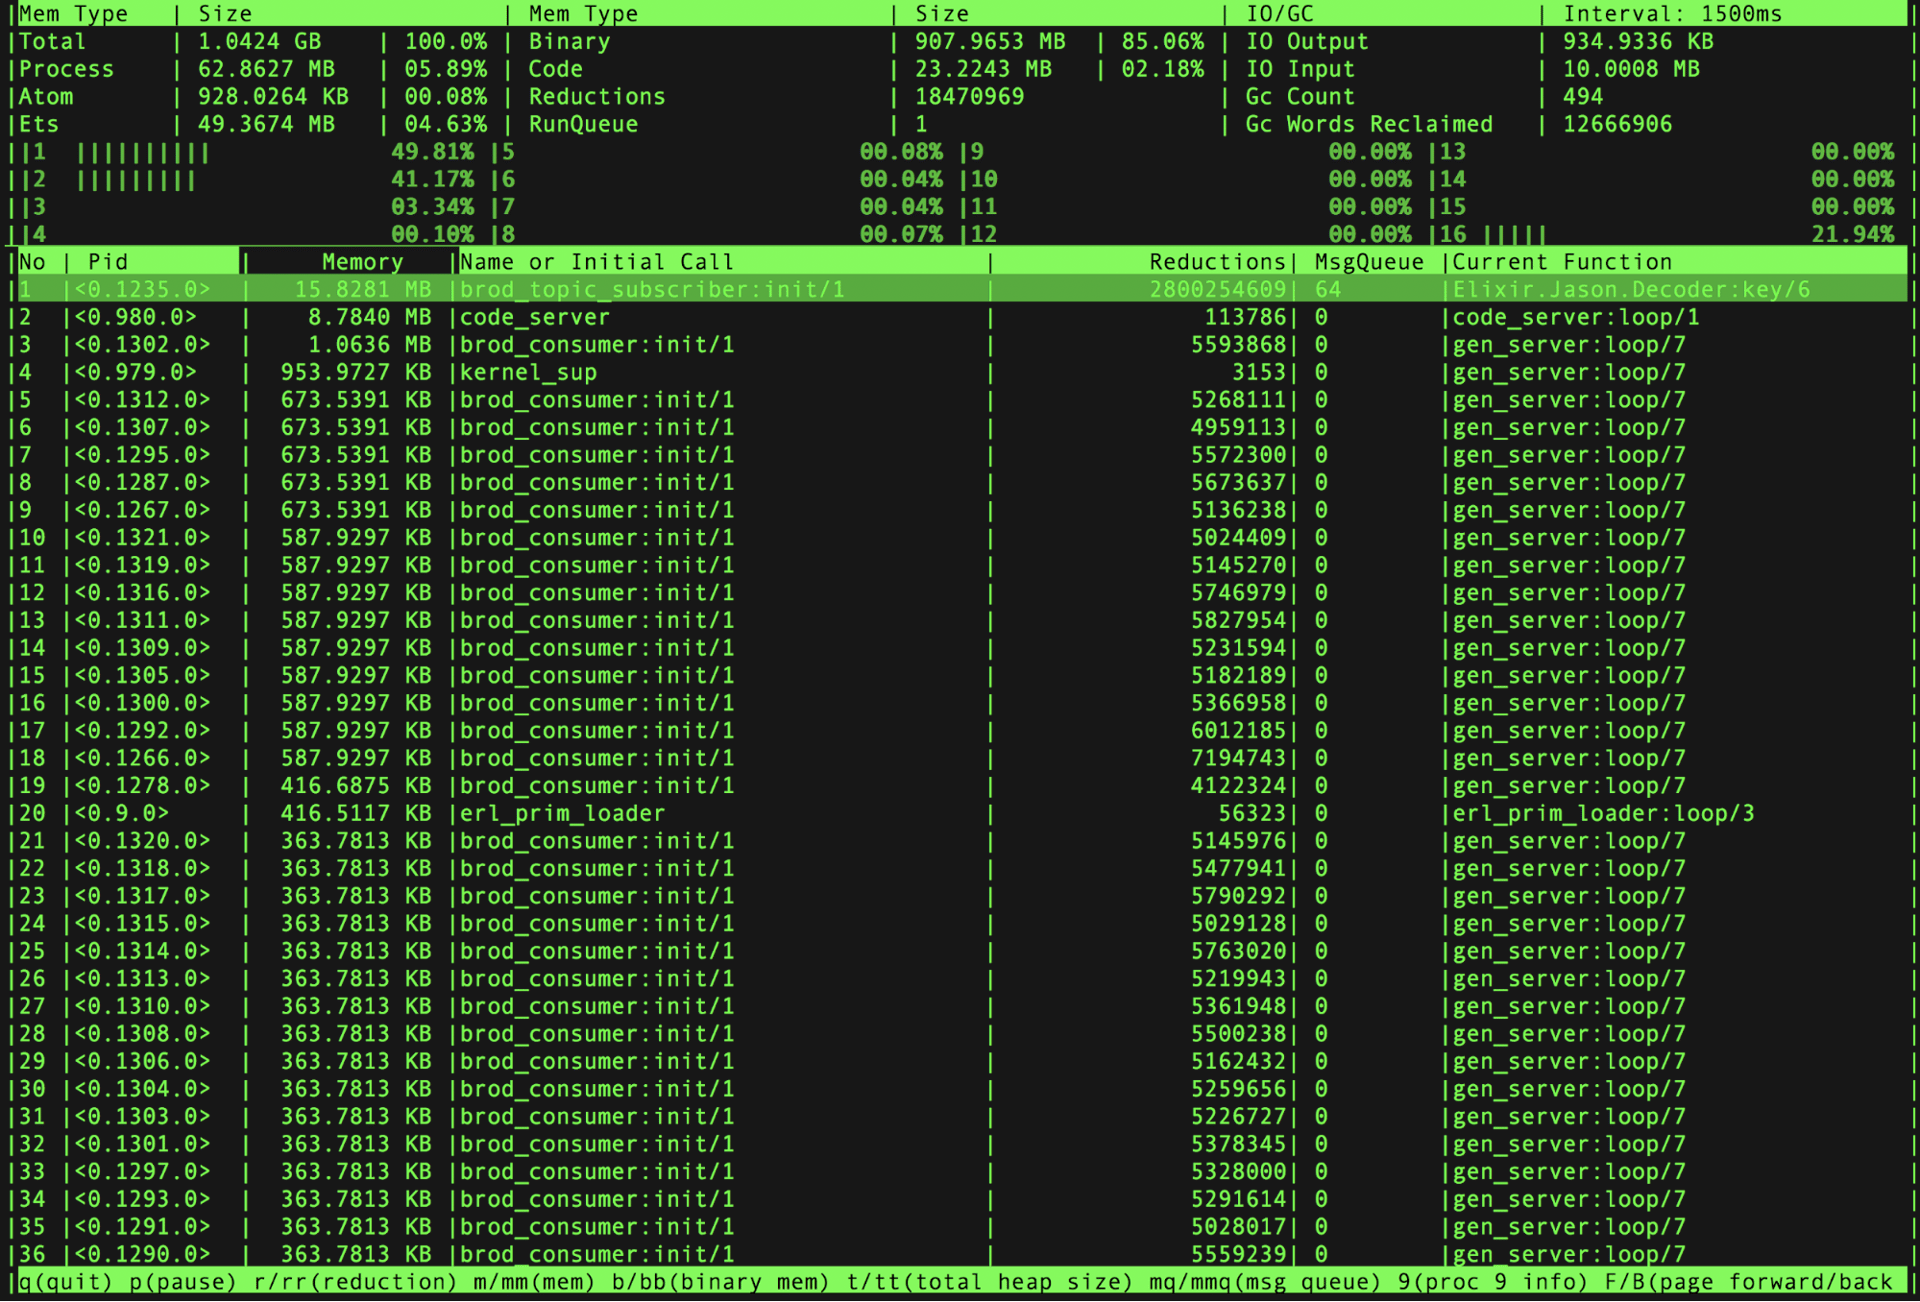
Using :observer_cli while attached to a service in production to get memory information about each process
Indeed, immediately after starting the service, I could see a lot of Kafka related processes using a lot of memory (there is one brod_consumer process spawned for each of my 64 Kafka partitions). The :observer_cli updates in real-time, so you can watch it for a bit to get a picture of the trends in your service.
This is a good start, but is not conclusive enough to say that there is a memory leak; lots of processes use many MB of memory.
Next I used :recon.bin_leak/1 to find the processes that were holding onto the most binary references. If they are the same processes that are using the most memory, then we might be on to something.
:recon.bin_leak/1 works by forcing a garbage collection and then watching to see how many references are let go. It returns the top N process (I just looked at 5). A larger negative number means a large amount of binary references were being held on to:
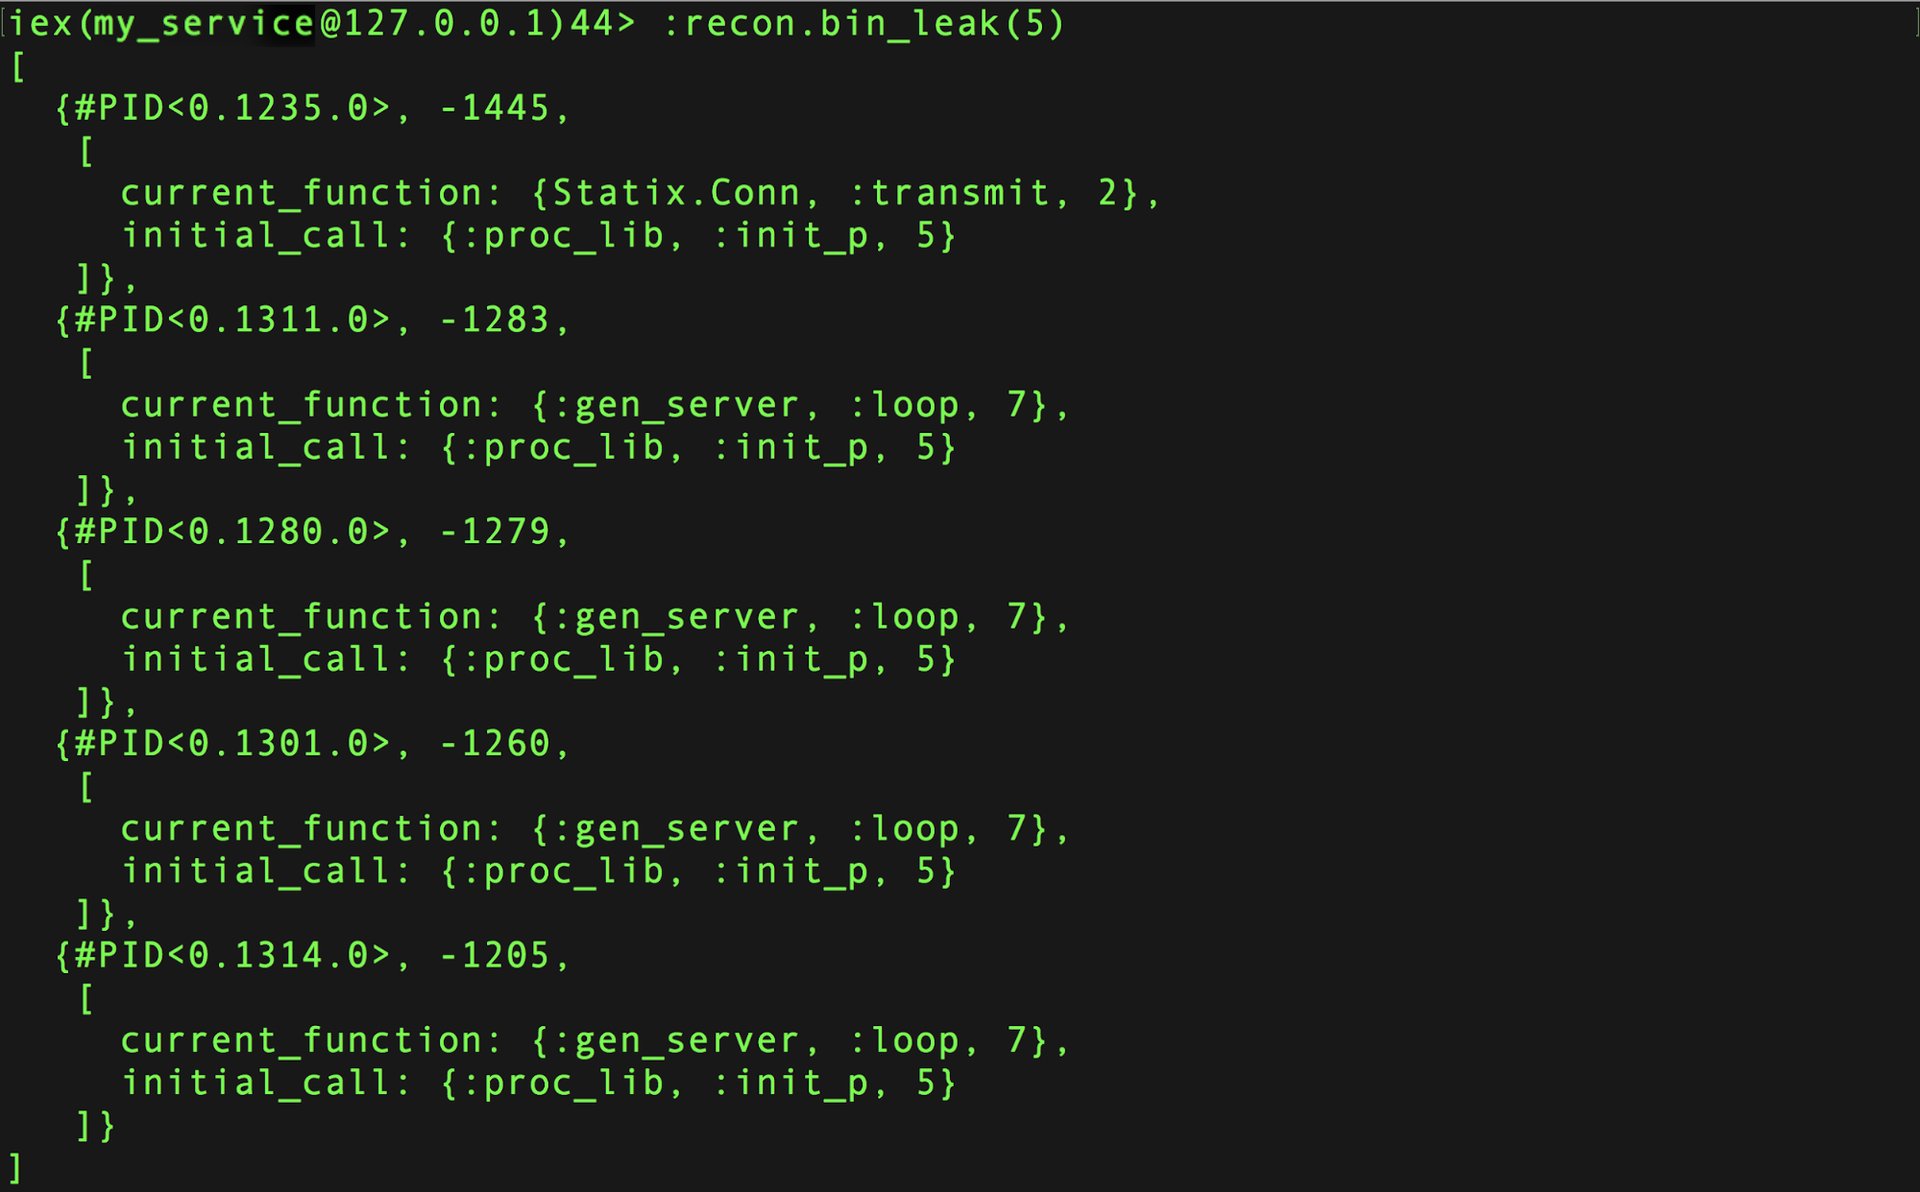
Using :recon.bin_leak/1 to see the top memory offenders
If we cross-reference the pids that were returned with the pids in preceding :observer_cli screenshot, we can see that they are indeed the same Kafka-related processes. Additionally, if we were watching the :observer_cli in real-time, we would expect to see those processes’ memory usage drop after triggering the garbage collection.
What does this mean? From the :observer_cli screenshot we inferred that processes were using a lot of memory. Now that we have used :recon.bin_leak/1 we can also say that those same processes are holding on to too many binary references, and we likely have a memory leak (which we suspected all along from the original DataDog graphs) because they seem to only release these references when we manually force a garbage collection.
. . .
Pinpointing the location of memory leak is not an exact science. We have found some clues that narrow down the scope of the problem to our Kafka process (the brod related ones), but now it will take some intuition and service-specific knowledge to yield more useful information:
- I know that Brod has one process per partition, and each of those processes wind up calling my
handle_message/1callback function - Each of the Kafka messages that my service is processing are at least 500 bytes
- I trust that there is no problem with ETS since it has been around longer than I have been alive
- I understand a little bit about how the
Loggerapplication works, and don’t think the problem is there (especially since it wasn’t one of the top memory-using processes)
This leaves only one function call left: the Jason.decode/1. Granted, Jason is a pretty popular library, so it is also unlikely that we are stumbling across an unknown major bug. Still, lets go look at the source code to see what we can find:
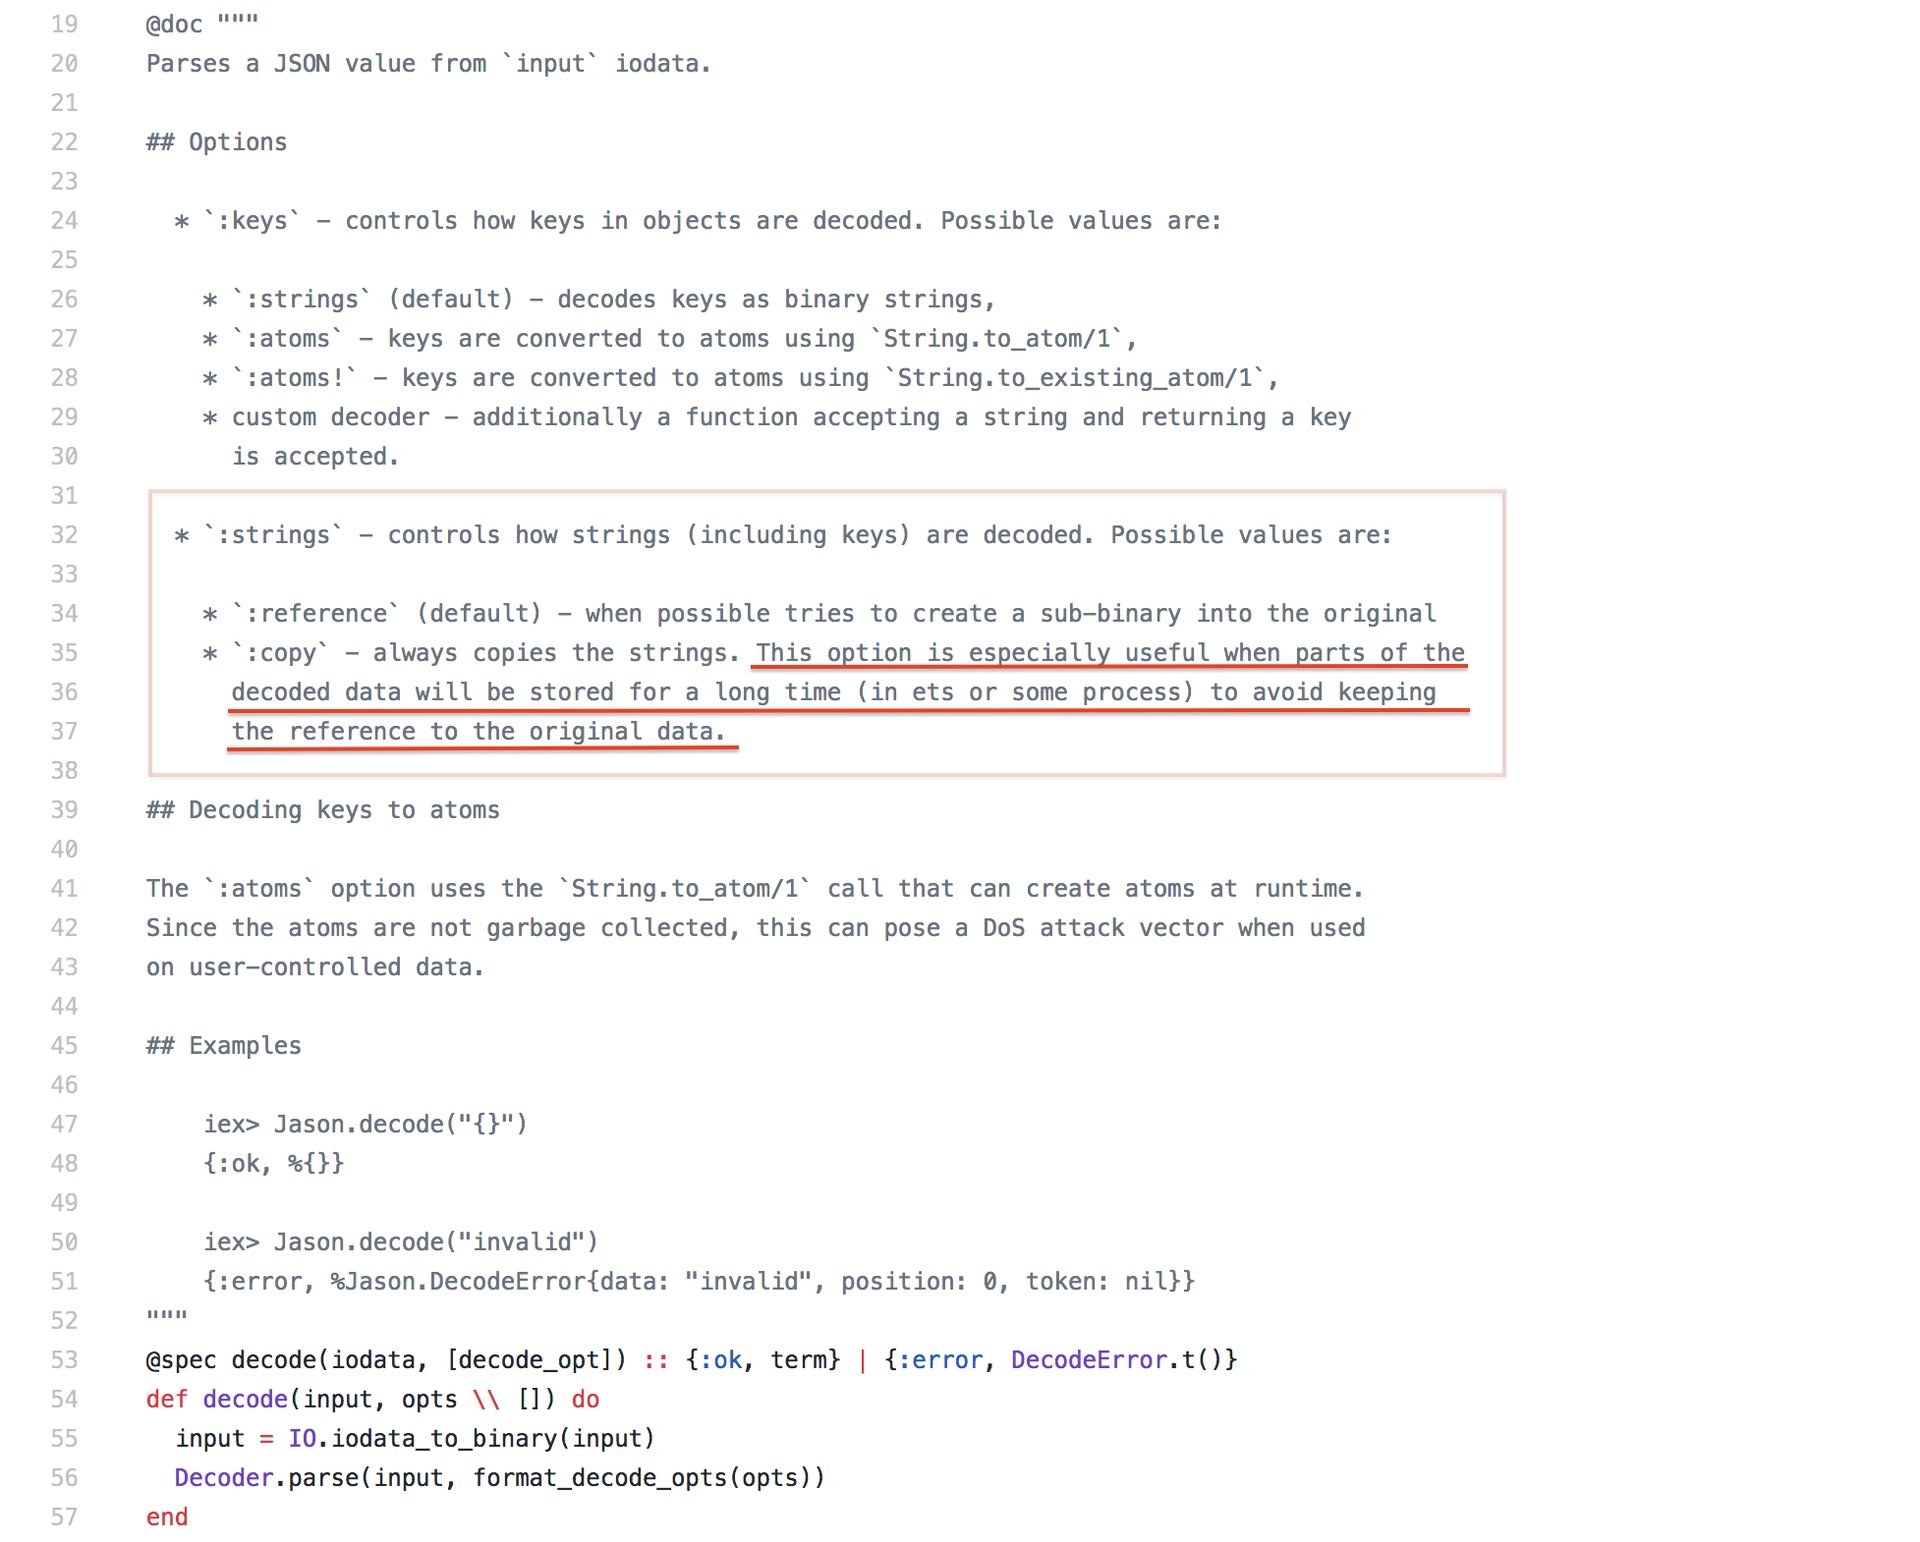
Ah ha! The decode/2 function allows for a :strings option which has a :copy value that is exactly what we were looking for:
This option is especially useful when parts of the decoded data will be stored for a long time (in ets or some process) to avoid keeping the reference to the original data.
This was a reminder about another piece of prior knowledge that I had forgotten about: any binaries that are over 64 bytes in size do not live on a process’ heap, instead, they get allocated on global “binary-only” heap.
Most of the time this is the best behavior, as keeping a binary in one place and sharing it is better than having copies in many different processes. However, since Erlang garbage collection uses reference counters to determine when large binaries can be garbage collected, you run into problems when things are stored in ETS for a long period of time, because the reference counter will never be reduced back to zero.
In our case, we had very small pieces of data (the id and description) that were referencing the original value of the Kafka message from ETS and from the Brod processes. When the Kafka work is done, those Brod processes would de-reference the binary, and the counter would drop. The problem was that it would never drop to zero because of lingering reference from ETS.
That is illustrated by this example I conducted in IEx where I used :erlang.process_info/2 to watch the reference count on a binary, and observed it going up (after inserting into ETS) and down (after removing from ETS):
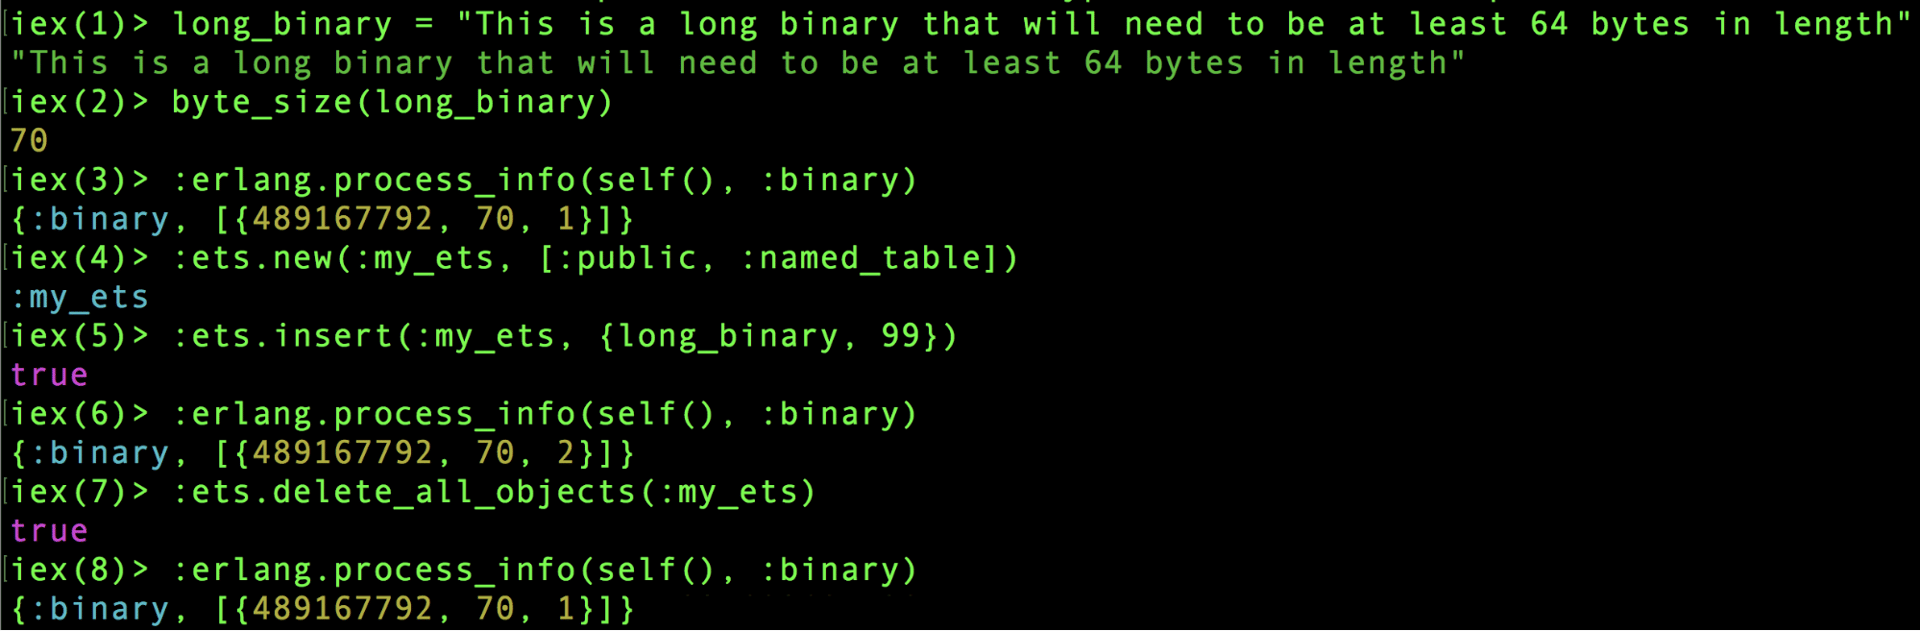
An example showing that inserting into ETS will increase the reference counter of a binary. Annotated code version here.
Lets unpack this:
- I defined a binary and verified that it was over 64 bytes in length.
- I used
process_infoto see all of the binaries that my process has. My process in this case is theIExprocess, and it only has the one binary we defined. The format of the tuple{489167792, 70, 1}is{binary id, bytes, reference count}. If there were more binaries, we might have been able to distinguish ours out based on the byte size. - Next, I created a new ETS table and inserted a tuple containing my binary (the
99is meaningless here). - I called
process_infoagain and observed that the third element of the tuple had changed from1to2because now the ETS is also referencing the binary (along with the originalIExprocess). - Lastly I deleted the binary from the ETS table and called
process_infoone last time to make sure the counter would decrement back to1.
Here is what the binaries look like if you were to define long_binary and copy it instead. Observe that there are now two binaries with identical lengths but different IDs:
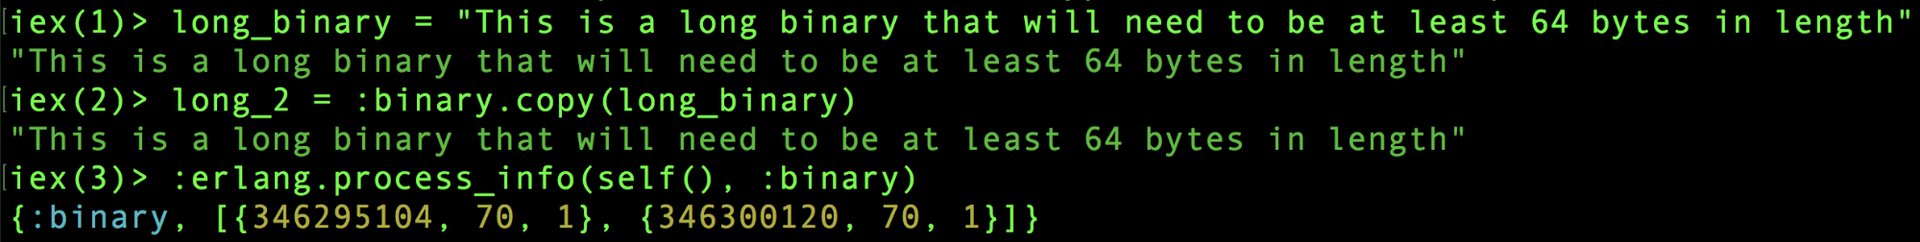
An example of `:binary.copy` and the resulting binaries on the process
. . .
Although using Jason.decode(value, strings: :copy) would have solved my problem, I opted to use :binary.copy/1 on the individual values so that it was clear which what I wanted to copy into my ETS table. This also is cheaper than copying a whole JSON object (which might be very large).
I came across other techniques for achieving similar results for different scenarios:
- Triggering a garbage collection manually doing
:erlang.garbage_collect/0(probably not a very good idea) - Hibernating a process when it is done (I have done this before, works well when you are in control of your own GenServers/processes)
- Spawn a one-off Task for doing your binary manipulation; when the task is done, the references counters will be decremented
Thanks to my co-workers for helping me out with this and pointing me in the right direction, but it looks like I still have some more work to do 😛
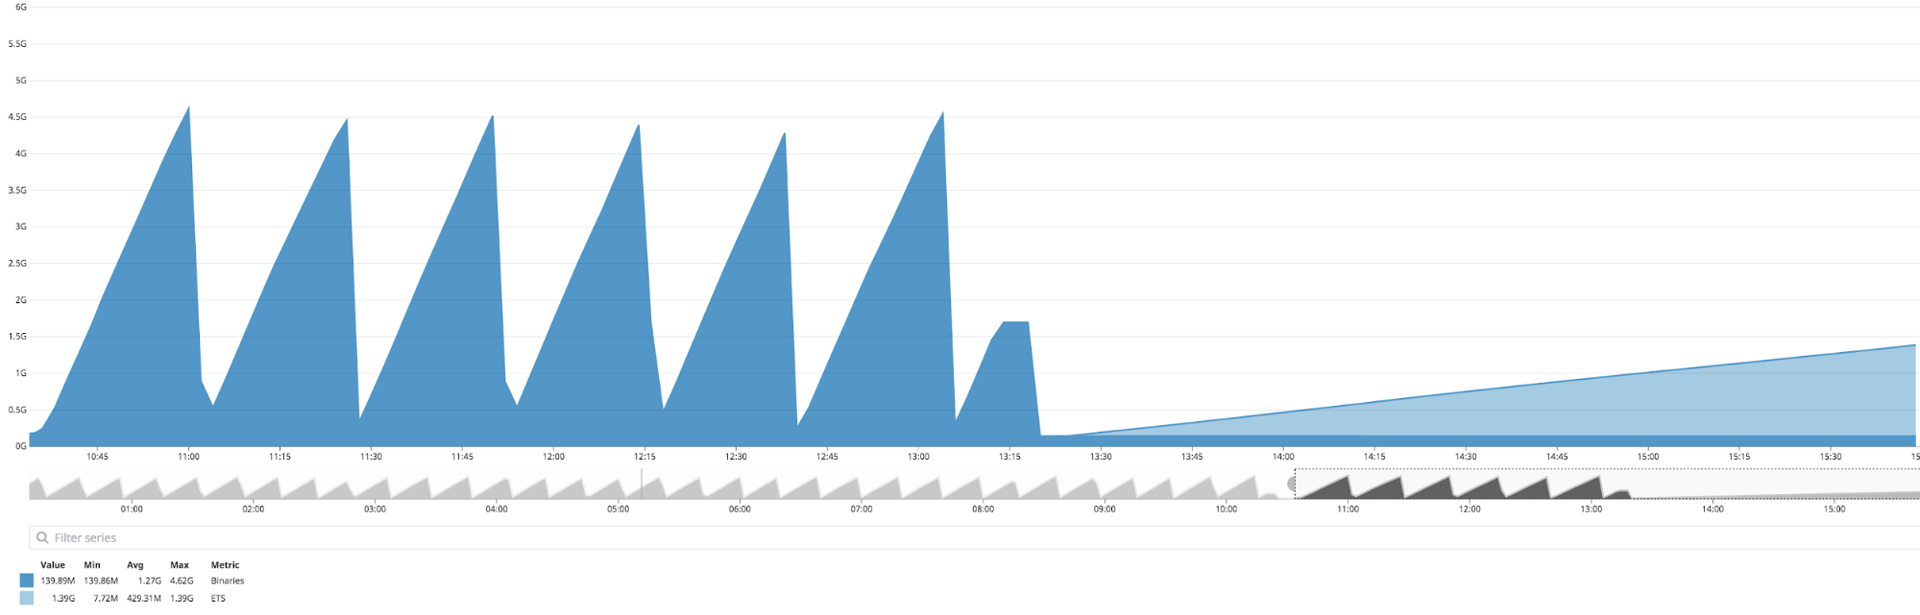
Datadog: The binary memory (dark blue) has stabilized, but now my ETS memory (light blue) is growing unbounded 😛