- PagerDuty /
- Blog /
- Best Practices & Insights /
- Service Monitoring and You
Blog
Service Monitoring and You
by Lilia Gutnik
October 24, 2019
| 7 min read
The author would like to point out that this blog was definitely not delayed multiple times by fellow contributors, Dave Bresci and Arup Chakrabarti.
Monitoring is an art form. That sounds cheesy and lazy, but the right kind of monitoring is very context-dependent and rarely does the same practice work across multiple pieces of software or people.
This gets even harder when you think about modern software architectures. Microservices? Container schedulers? Autoscaling groups? Serverless? ${New-technology-that-will-solve-all-of-my-problems-but-probably-creates-other-problems}?
On top of all of this, the definition of what a “service” is depends on who you talk to.
To a software engineer, a service is an isolated chunk of functionality that is powered by the previously mentioned technologies. To a customer, a service is a product that they are paying for. To a CEO, a service is something that goes down so that they can yell at their SVP of Engineering.
In this post, we will share how we, PagerDuty, set up and monitor our services within our own instance of PagerDuty. You’ll learn some tips for how to approach full-service ownership without losing (much) sleep, and keep your customers and business stakeholders happy.
Figure Out the Service and Components
A service is typically made up of multiple components. For most well-formed teams, they will own 5-10 services in production, with 3-5 components per service. Ideally, a service is owned by a single team that has full ownership over the components. If that is not the case, the components are the first area to look at dividing ownership over.
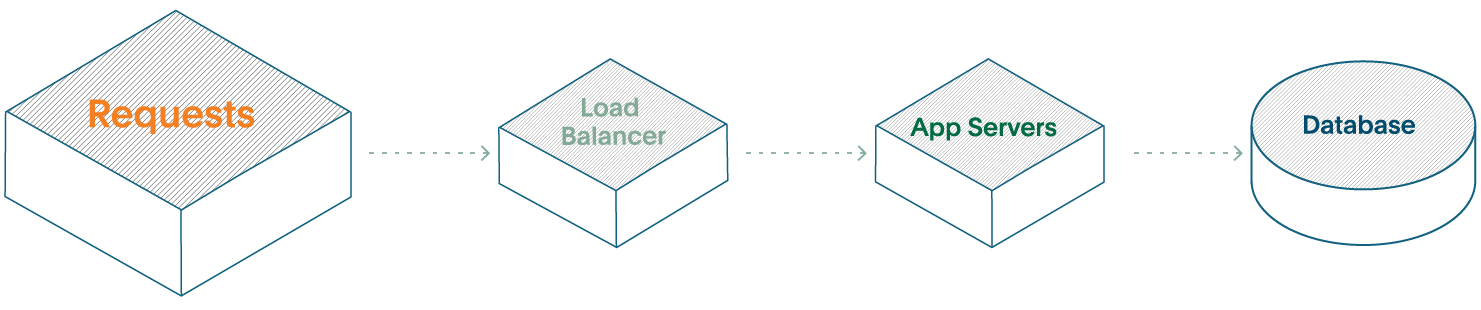
Let’s take a look at a typical three-tier web service.
- You will have your Load Balancer for request routing
- Your Application servers will be running the business logic (oftentimes, this is the only part that is considered part of “The Service”)
- Your Database is for actually keeping your customer’s data.
In this scenario, we have three components as part of one service.
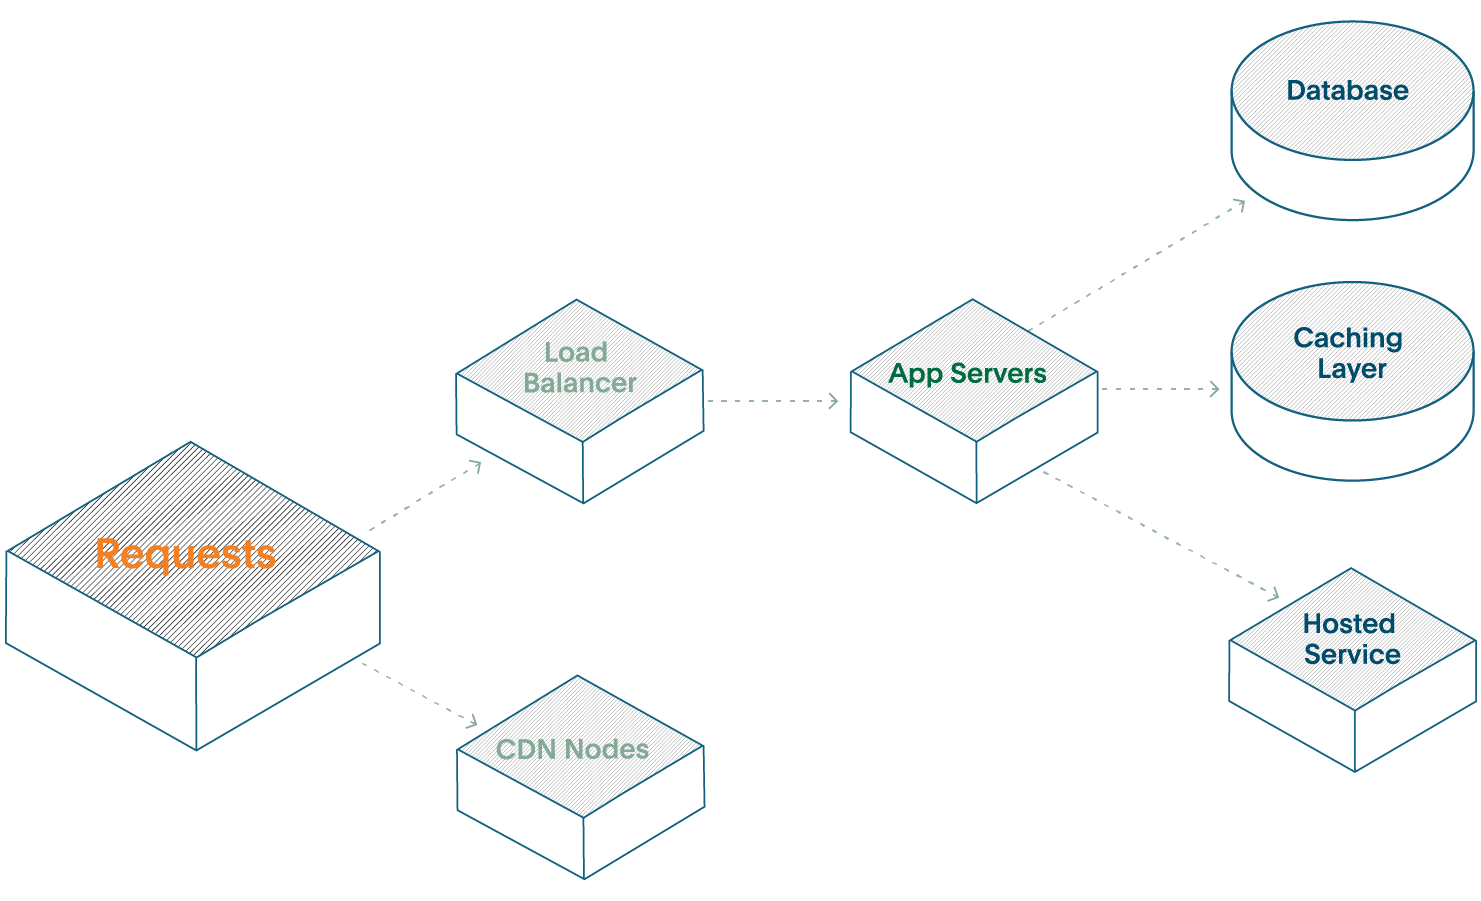
Now, let’s start to scale this web service. You will likely add some caching layer to save your poor Database, add some CDN nodes to speed up performance, and use a hosted service to offload some work yourself.
Now you have a single service made up of six disparate components. Each component needs some level of telemetry and visibility, but that doesn’t mean you need to monitor and alert on every component. Doing so will cause you to focus on component health, when you should be focusing on the overall health of the service instead.
There are different ways of modeling even a “single” service like this—some organizations consider shared infrastructure layers, such as networking layers or databases as a separate, distinct service from the customer-facing services.
Focus on Customer-Impacting Alerting
To start, aim for the most basic alerting for the behaviors that your customers care about. Remember, customers can be internal teams or external people paying for your product. This usually starts with basic ping monitors (Is it up?) and evolves to more sophisticated questions (Is it running fast enough?).
The hard part here is that it is very difficult to anticipate every single way that your customers are going to use your service. This is where it is actually ok to let some problems bubble up too late, and then figure out later how to monitor and prevent issues in the future. If you try to anticipate every problem, you’ll end up creating hundreds of alerts that become noise. Think of broad categories like Availability and Performance first and, as you iterate, get more granular.
For example, with Availability you can begin with % of HTTP requests that are served successfully, then move to error breakdowns, breakdowns by component, and so on. For performance, you can start with overall page load time, then move to individual page components, third-party content, multi-page transactions, and so on. Consider the danger of averages and embrace the way of percentiles. You can read more about that here: https://www.dynatrace.com/news/blog/why-averages-suck-and-percentiles-are-great/ and here: https://medium.com/@djsmith42/how-to-metric-edafaf959fc7
Adding Alerts Is Easy, Deleting Is Hard
Never be beholden to old alerts. What made sense when your service had 10 customers and three components does not make sense when you have thousands of customers and a dozen components.
If you answer yes to any of the following questions, it’s a sign that you should get rid of an alert:
- Do people ignore this alert?
- Do you snooze this alert most of the time, waiting for a different alert to come in that’s more relevant or important?
- Does the wording of the alert reflect an old way of thinking or something that no longer exists?
We have talked about the importance of Operational Reviews and a critical part of them is understanding what alerts you can remove. A general rule is that if an alert resulted in no action for three straight review cycles, remove it or turn it into a suppressed event that you can look at later. It may turn out that you need to optimize your service configuration in PagerDuty.
Defining SLIs, SLOs, and SLAs Is Really Hard
Below are the definitions that we use internally at PagerDuty, but if you’re not familiar with the terminology, we highly recommend reading Google’s books on the topic.
Briefly, think of SLAs, SLOs, and SLIs as follows.
SLA (Service Level Agreement). What you publish as a promise to your customers. Each service should have exactly one SLA. Example: 99.9% uptime.
SLO (Service Level Objective). Your internal target for your SLA. Typically, it’s a more conservative version of your SLA. Example: 99.99% uptime.
SLI (Service Level Indicator). Objective facts about the current state of your service that help you answer whether you are achieving your SLO or SLA. For example, the percentage of requests that got an HTTP 200 response in under 300ms.
Like most services you launch, you may get your SLAs, SLOs, and SLIs wrong on the first try—and that’s ok. What’s more important is to get something defined so that you can refine over time as you learn more about your service and your business.
A good evolution could look like:
- Percentage of requests that did not result in a 5XX response.
- Percentage of requests that did not get a 5XX response and was completed in under 300ms.
- Percentage of requests that did not get a 5XX response and was completed in under 150ms.
At PagerDuty, it took us years to figure out how to accurately measure what our customers cared about, and what matters to them has changed dramatically over time. While our definitions of our internal SLAs, SLOs, and SLIs are not perfect, we have something that can refine over time as our teams learn more about what matters to customers. For more on how SLOs can drive healthy service monitoring and influence business decisions, listen to Liz Fong-Jones’ QCon talk, Cultivating Production Excellence.
It’s Worth It
Doing all of this work isn’t easy, and it’s never going to be finished or perfect. But it’s worth it.
Your team will have a clearer idea of what’s going on instead of panicking when something goes wrong. They will be able to focus on the problem and have a clear sign of when they are done.
People can’t respond to everything like it’s a crazy emergency; understanding and publishing your SLAs allows people to know when and how they have an error budget to work with. Tuning your alerting will keep people focused on real problems instead of getting numb to alert noise.
And most of all—do this because your care about your customers. If you’re not tuning and iterating the monitoring of your services, you are passing pain directly to them. For more on how to optimize your service configurations in PagerDuty, read here: https://support.pagerduty.com/docs/best-practices-service-configuration
Let us know how you think about service monitoring. We would love to hear how other people work through this process.