- PagerDuty /
- Blog /
- Digital Operations /
- 3 Tips and Tricks to Get the Most Out of Operations Command Console
Blog
3 Tips and Tricks to Get the Most Out of Operations Command Console
by Ophir Ronen
December 19, 2016
| 3 min read
Recently, we announced new innovations in digital operations management which extend our market-leading platform beyond alerting, notification, on-call automation, and triage to event intelligence, and end-to-end response orchestration. Here are three helpful tips to maximize your investment with the Operations Command Console and Intelligence Applications to effectively manage your customer experiences.
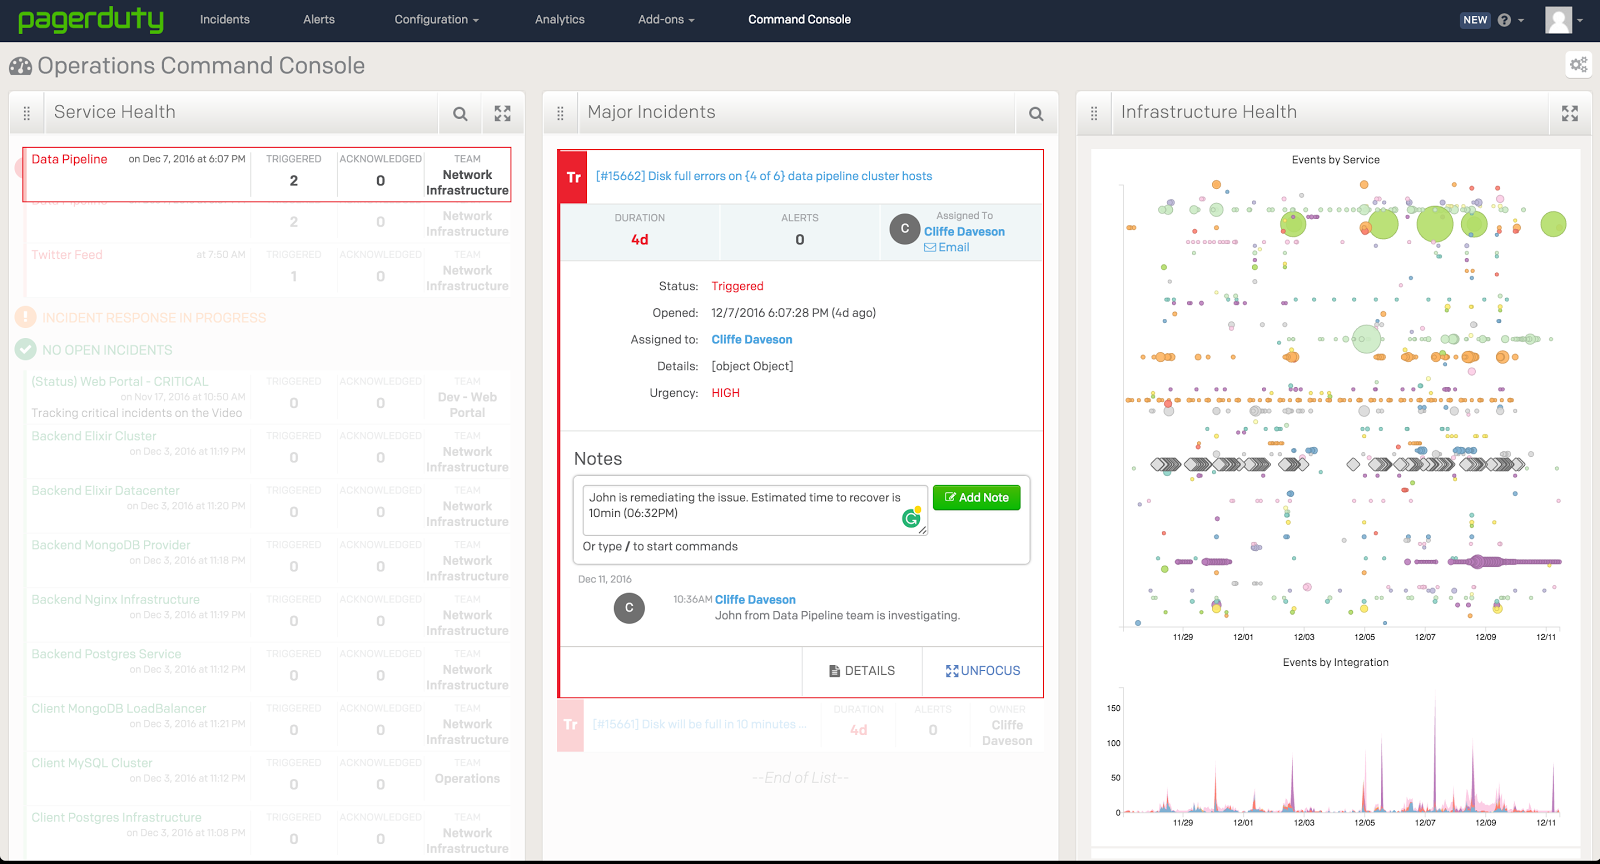
Tip #1 – Update an Incident
The Operations Command Console’s Major Incidents module empowers you to quickly view and understand the major incidents occurring within your infrastructure. The image below shows two options that are presented when selecting an existing incident: details and focus.
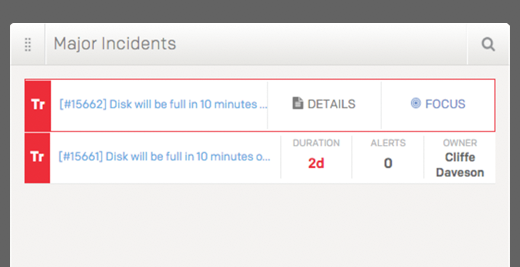
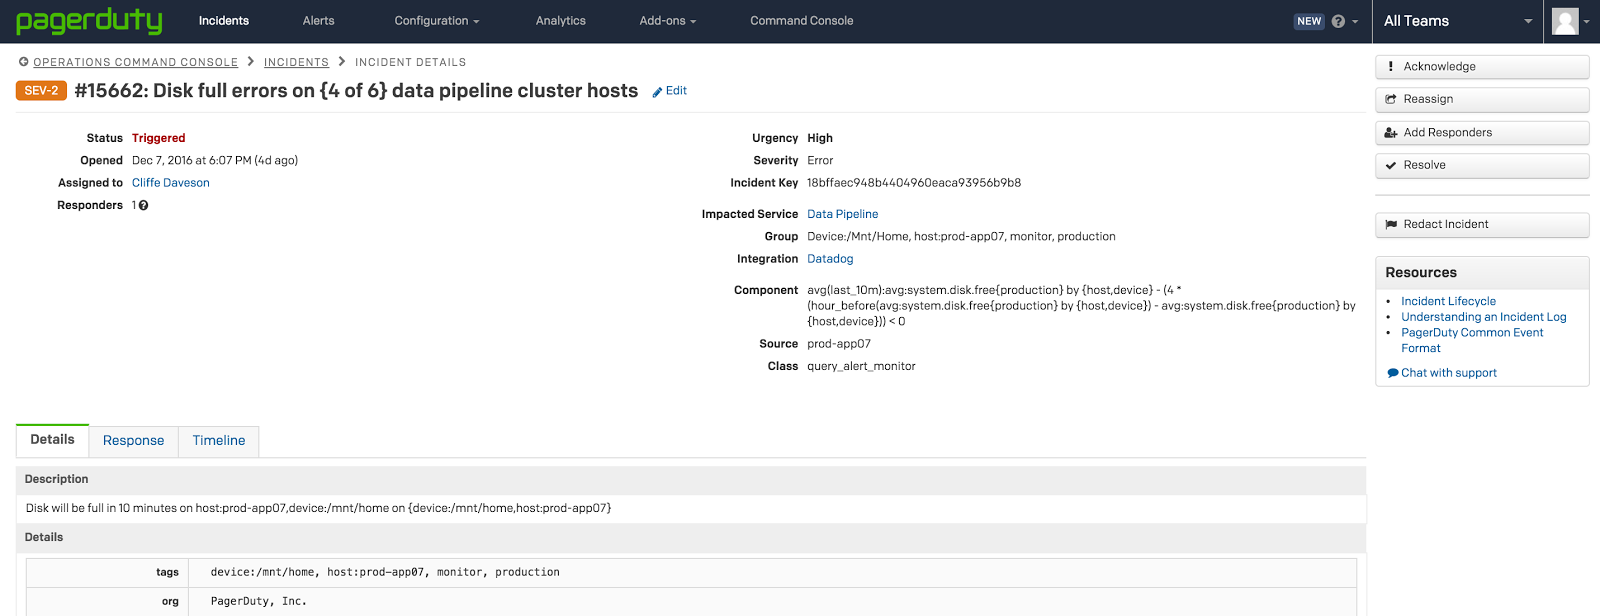
When you click on details, you will be taken directly to the incidents page. The incidents page enables you to use the full array of PagerDuty’s robust incident response capabilities.
Clicking on the focus option will bring the other modules in the Operations Command Console into the same context as the incidents (e.g. showing affected services in the Service Health Application and related alert clusters in the Infrastructure Health Application).
You can quickly assess the scope of the incident by examining the relevant alert clusters and services associated with the incident. Focus mode on the incident provides a quick and easy way to enrich the incident with additional information and context using the notes feature.
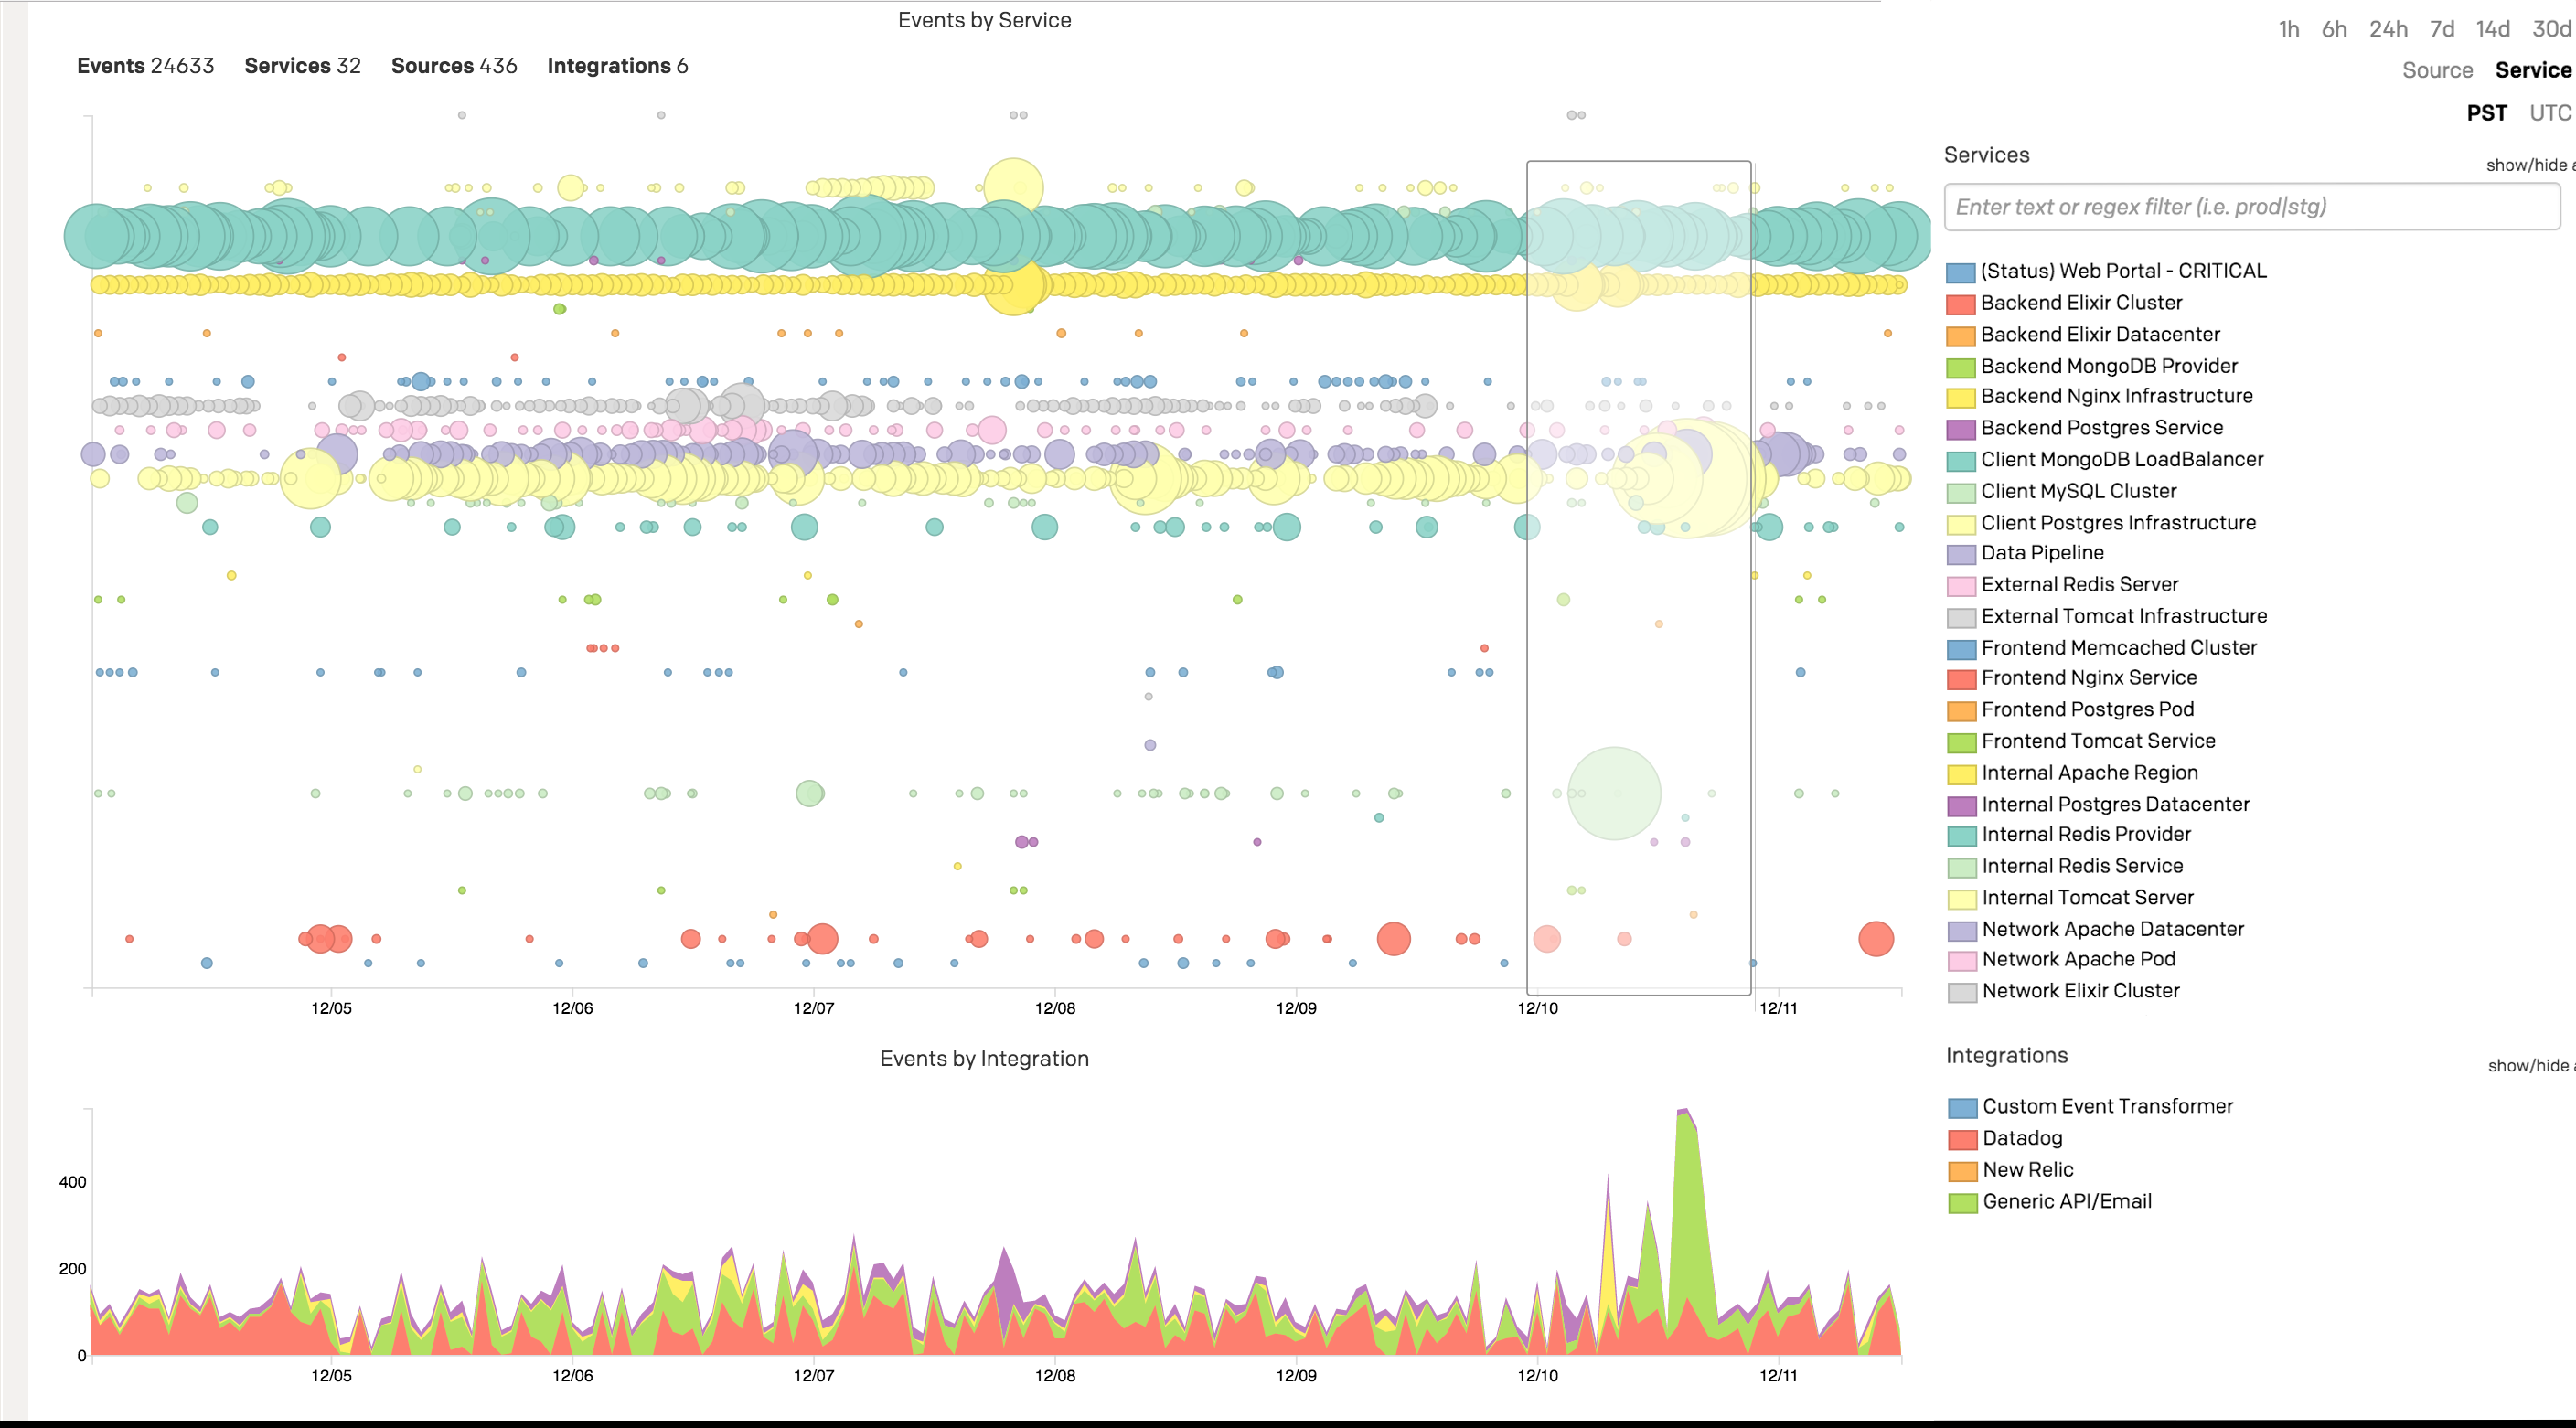
Tip #2 – Gain Insight Into the Impact of an Incident with Cluster Alerts

PagerDuty’s Infrastructure Health Application provides a novel way of assessing the business impact and blast radius of impending incidents. The x-axis of both the bottom graph (showing event volume by integration) and top graph (showing alert clusters by service) share the same time scale. The y-axis of the event volume graph indicates the number of alerts associated with each integration, while each tick on the top graph displays individual services. By reviewing the event volume graph and looking for peaks (surges of alerts), you can easily pinpoint areas of potential impact using the peaks as “fingers” pointing at the problem areas in the top graph.
Tip #3 – Zoom into the Exact Timeline of Service Cascades and Large-Scale Incidents
The Infrastructure Health Application top graph allows you to get a rapid assessment of the incident blast radius. As we can see from the example above, a significant event occurred in the latter half of 12/10. By clicking, dragging, and selecting the area of interest, we can get a more comprehensive view of the situation. For example, the graphs show the length of time the problem spanned as well as what services were impacted.
Interested in giving the Operations Command Console a try? Sign up for a PagerDuty trial and you’ll get a 14-day free trial to the Operations Command Console as well. Already a customer? Contact us today and we’ll get your account set up for a trial!