
- PagerDuty /
- Engineering Blog /
- Improving PagerDuty’s Automated iOS Builds
Engineering Blog
Improving PagerDuty’s Automated iOS Builds
by Ryan Walberg
December 21, 2017
| 12 min read
Background
I started at PagerDuty during a time of revitalization of the iOS app. Apps tend to need a lot of care, given that Apple changes the rules every year, and your dependencies don’t stay still either.
Here’s a list of the problems and the pain we were experiencing:
- We had very few unit tests and our integration tests were done with KIF. They failed about half the time and we weren’t sure why.
- The automated builds took over 20 minutes to run on Bitrise (our CI system).
- We couldn’t be sure that we weren’t breaking things when we made changes.
- Our CocoaPods dependencies were out of date and we didn’t feel comfortable updating them all at once.
- Actual release builds involved running some steps on developer machines, and required a pull request each time. The whole process took about two hours.
- We were still distributing test builds through Fabric, which is a great system, but it was an extra system we could replace with TestFlight. Since all PagerDuty employees dogfood the mobile apps, we were always updating a list of UDIDs! Ouch.
Goal
Our dream environment looked a little like this:
- Bitrise would run all our tests smoothly, with at least 95% reliability.
- Developer build times would improve.
- Bitrise build times to improve as well. We were hoping for under 15 minutes.
- We would move away from integration tests (slow) and lean more heavily on unit tests (fast).
- Bitrise would completely perform our release builds, including submitting it to our beta testers and the App Store.
Tackling the Problems
We couldn’t spend entire sprints fixing things up, so we had to tackle our problems one at a time. The last thing a Product Owner wants to hear is that you’re going to spend a few sprints working on the build, not fixing any bugs or building features!
We prioritized our build issues and got to work. Our most immediate problem by far was that the integration tests would fail intermittently.
Fixing flaky tests
Our integration tests are written with the KIF framework, a similar framework to UI testing, which accesses a running application using the accessibility layer. They were failing frequently on our Bitrise workers, and we didn’t run them locally very often.
We started by running the tests over and over locally so we could see what was failing. The theory was that Bitrise workers were slower than our machines, and they failed more often during odd hours (maybe when they weren’t warmed up), so we tried loading our machines with fake work and running the tests. We could get some failures where the tests were not expecting animations to be running, so we sprinkled in some tester().waitForAnimationsToFinish(), particularly during navigation transitions.
One of our members discovered that you can speed up all animations by a factor of three with this code:
UIApplication.shared.keyWindow?.layer.speed = 3.0Once this change was committed, the tests began passing locally almost every time. Once pushed to Bitrise, they passed much more reliably.
Extracting screenshots from Bitrise
When a KIF test fails, it will automatically take screenshots of the application if it has been told to. The filename is the test file name and the line number of the failed interaction.
To get a zip file of these failed screenshots, just do a few small things to your project.
- Set the
KIF_SCREENSHOTSenvironment variable in Xcode under Edit Scheme > Test > Environment variables. We set it to$(SOURCE_ROOT)/Integration Tests/Screenshots. - Create that directory and added a placeholder file so that it doesn’t get removed. The best thing to do is make a
.gitignorehere that specifies*.png(you don’t want to accidentally commit these to git). - Add a Bitrise Deploy step to zip up the contents of that directory.
Now when a build runs, it will zip up the contents of that directly, assuming anything is there. Bitrise then attaches that zipfile to the build! Then we can just unpack it and see what the app was doing at the time of failure.
Start focusing on unit tests
We didn’t have a lot of unit tests, just a handful for utility classes and non-UI functionality. We wanted to cover our view controllers with unit tests too. We didn’t convert integration tests to unit tests, as integration tests still have a lot of value, but we did start focusing more on unit tests in future pull requests.
At the same time we were moving away from fat view controllers, towards better-organized MVC and MVVM, where appropriate.
By having more clearly-defined components with more clearly-defined responsibilities, the code became easier to test. View controllers that previously required a network mocking framework like OHHTTPStubs were now able to use stubbed-out models. When unit tests are easier to write, you test more situations, like bad HTTP response contents, and HTTP failures.
Fun fact: a single integration test to launch the app, open a view controller, enter some text into a few fields and tap a button takes about 5 seconds, not to mention being a pain to code, and requiring network response stubs. On the other hand, we can run all 150+ of our unit tests (we’re just getting started) in about 10 seconds, testing more application components, and requiring no network stubs.
New pull requests involve unit tests that cover ~80% of the submitted code, as well as an integration test or two that at least covers the happy path of any new user interface. New pull requests with user interface changes also come with snapshot tests, described below.
Adding snapshot tests
Integration tests will tell you that controls exist and do what they’re supposed to, and unit tests will check that the code behind them will work in almost every situation, but that won’t check that user interfaces maintain their layouts and don’t break. That’s where FBSnapshotTestCase comes in.
A snapshot test will test your view, pixel-by-pixel. The code for such a test will:
- Instantiate a view controller (or view), sometimes manually, or from a storyboard, if that’s where it lives.
- Provide the view controller or view with the data it needs. This is easier if you’ve got view models and models.
- Set control states.
- Call
FBSnapshotVerifyView()on the view controller’s.view, or an isolated view outside of a view controller.
The call will fail the test if the view doesn’t match what you’ve recorded, pixel-for-pixel.
Where do you get those recordings? Just set recordMode = true on the test and run it. It will generate the images in the configured location. Comment it out after and run it again, and it will match. (If it doesn’t, you’ve got some timing issues to deal with!)
Pro tip: extend FBSnapshotTestCase with your own subclass, and then subclass your test classes from that. Then, when you target a new phone or OS as you will probably do once a year, you only need to add recordMode = true to the setUp() in the base class, run all the tests, and it will regenerate all your snapshots.
class PagerDutySnapshotTestCase: FBSnapshotTestCase {
override func setUp() {
super.setUp()
// uncomment the next line to record *every* snapshot again
//recordMode = true
}
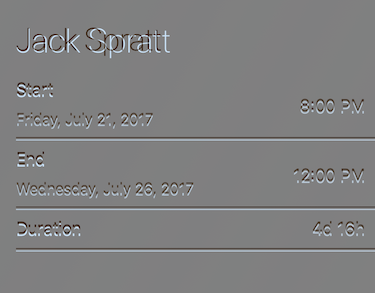
}The FBSnapshotTestCase library produces a superimposed image of the expected image over the actual image (or vice versa), highlighting the differences. In this example, a font size was changed by accident, pushing the labels below it down. The remaining contents of the view do not appear, as they are identical.
To get these images on Bitrise, we just had to add another Bitrise Deploy step to zip up that directory.
It’s very rare for one of these tests to fail on the CI server and not locally. The most common reasons are time zones and Daylight Savings Time.
These snapshots are device-dependent, and actually iOS version-dependent, as the font kerning frequently changes every major iOS release.
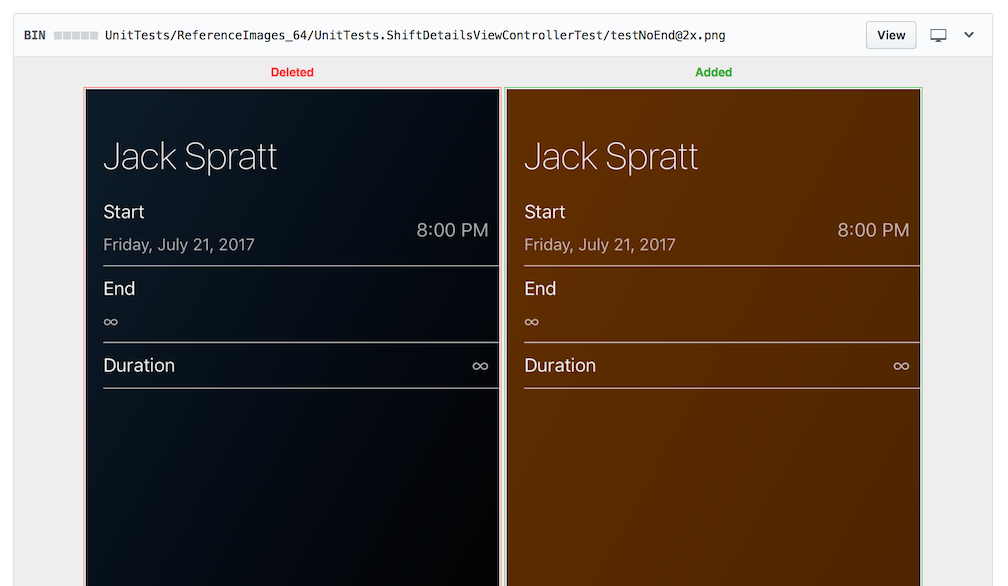
Another great thing about storing your snapshots in git is that pull requests which intentionally change the layouts will show the snapshots before-and-after, which illustrates to your reviewers visually what you’ve done!
Moving to TestFlight
We were still distributing some beta builds through Fabric, which was great at the time, but it meant maintaining another list of testers and UDIDs on another website.
At the same time, we moved crash reporting from Fabric to New Relic, which the company was already using for everything else.
We created a TestFlight group for the users who were receiving the iOS build through Fabric, migrated the list over, then removed the Fabric SDK from our app.
Verifying code coverage
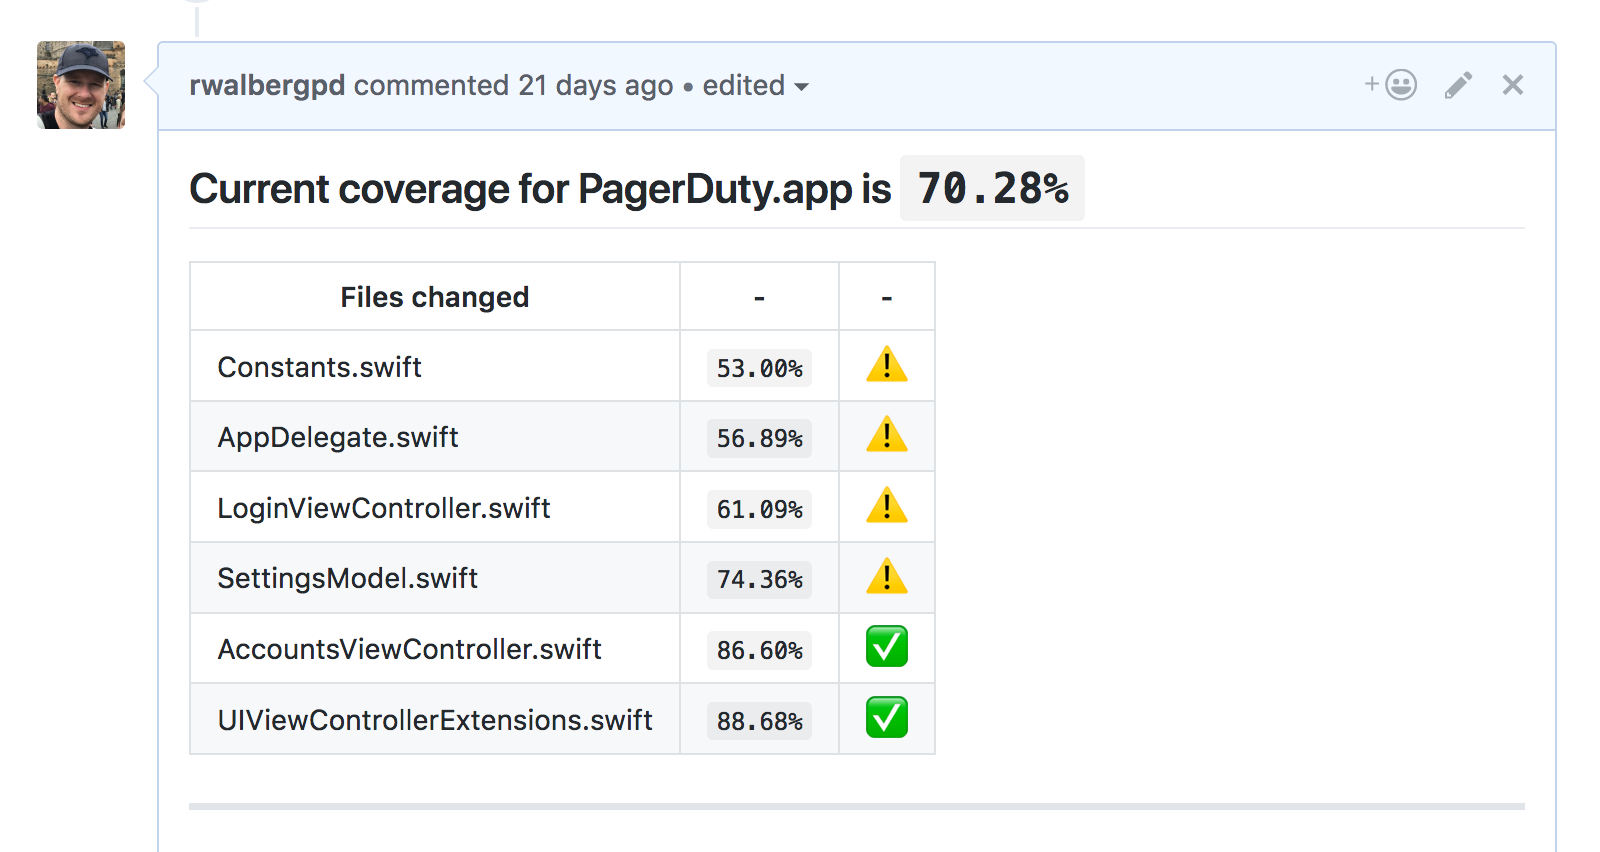
Measuring code coverage is all well and good but if it’s not being presented to developers regularly, it’s not of much use. That’s where Danger and danger-xcov come in!
Danger uses the information produced by xcov (which itself uses code coverage output produced by Xcode) to insert code coverage reporting into your pull requests. It highlights new and changed files, and tells you the coverage percentage.
Danger can be configured to fail your build if coverage is below a certain threshold.
Speeding things up
Our builds were slow. Really slow. Building from scratch on a 2016 MacBook Pro took about three minutes, and about nine minutes to build and run all the tests. On Bitrise, it took 25 minutes! That’s far too long.
There were a number of issues with the project structure, and we tackled them one by one.
Test files were being compiled when trying to Run
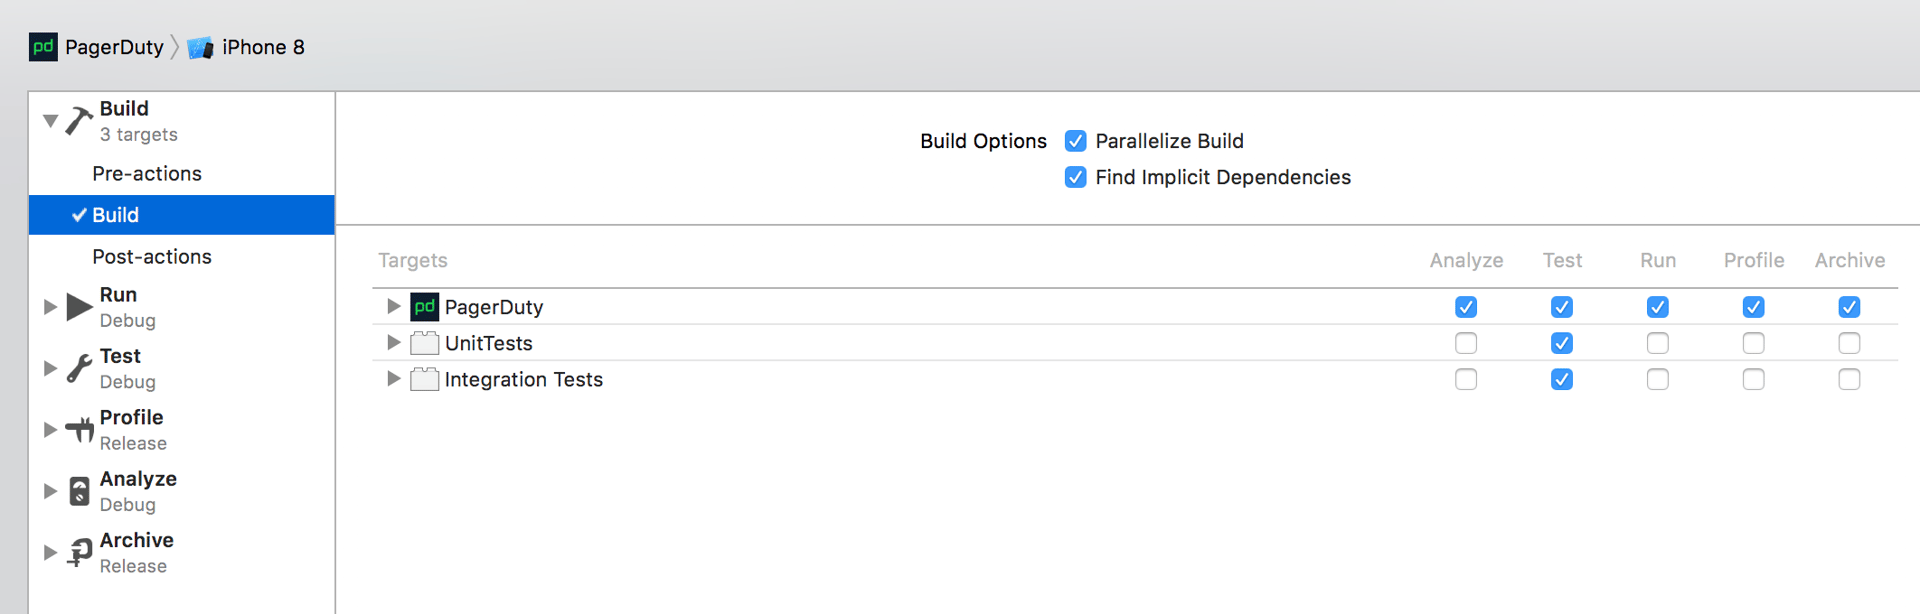
Something that stood out to us was that if there was an error in a unit test (usually because the application code changed out from under it), it would fail the build when trying to Run! This makes no sense, as these files shouldn’t be compiled in that situation.
The problem was that the testing targets were mistakenly checked off for Run in the Build action. Here’s what it should look like:
Shared files were being compiled multiple times
We have a few targets that share files, like the app, the Today extension, the Watch app, and the Watch extension. Those files had multiple targets selected. Ideally Xcode would be able to compile these files once, but technically each target could have different compiler settings under which they’d be compiled.
To solve this, and make things tidier, we moved those files into a shared framework, made those targets depend on the framework, and then they were only being built once.
The build seemed to hang on some files
While watching a build, the swift compiler process seemed to pause on the same files every time. The odd thing was that these files didn’t contain anything complicated. We started to suspect that the Swift compiler was tripping on some kind of construct.
Following the instructions in this article we enabled the compiler flag and sorted the output by the slowest functions first. I am not making this up when I say we found a single function that computed a hash code that took 74 seconds to compile (on that same 2016 MacBook Pro)! By rewriting the function into multiple statements, it didn’t even take 10ms to compile. When combined with the former change, which resulted in this code being compiled six times instead of one, our Bitrise build-and-test time from 25 minutes to about 14 minutes!
Before:
var hashValue: Int {
    let r = (
        (start?.hashValue ?? 0) ^
            (end?.hashValue ?? 0) ^
            (escalationPolicyName?.hashValue ?? 0) ^
            (escalationPolicyId?.hashValue ?? 0) ^
            (escalationLevel?.hashValue ?? 0) ^
            (escalationLevels.hashValue)
    )
}
After:
var hashValue: Int {
    var r = (start?.hashValue ?? 0)
    r ^= (end?.hashValue ?? 0)
    r ^= (escalationPolicyName?.hashValue ?? 0)
    r ^= (escalationPolicyId?.hashValue ?? 0)
    r ^= (escalationLevel?.hashValue ?? 0)
    r ^= (escalationLevels.hashValue)
    return r
}
CocoaPods installation is slow
We were undergoing a centralization of third-party libraries into Artifactory and needed some way of not referencing the master CocoaPods spec repo. After trying out various techniques, we couldn’t accomplish what we wanted to do and maintain fast builds.
After weighing the pros and cons, we decided to simply store the CocoaPods Pods/ directory in git along with our project. This brought several benefits:
- Allowing (read: forcing) us to review code changes in our app – a lot of the code in your dependencies is worth reading!
- Improving the setup experience for occasional mobile developers – no
pod installwith long clones. - Knocking another minute off our build time on Bitrise!
Automated builds
The final frontier of automation is automated builds. Unfortunately, we were building the release on developer machines, then uploading it to Apple, which at the time was about as good as it got.
It’s 2017, and fastlane is the new standard, so we wanted to completely automate the build-and-upload steps. The trick was triggering this process in the first place.
We configured Bitrise like this:
- We set our release workflow to trigger off new tags.
- We added multiple steps to the workflow that set the app version to the tag name, and the build number to the Bitrise build number. (You need one step per target plist. If you miss one, the iTunes Connect upload will detect the non-matching versions and fail.)
Actually uploading to iTunes Connect is still handled by fastlane.
Now we can create a tag like 5.12.1 in the GitHub UI using any commit (typically master), and it would automatically build off that tag, using 5.12.1 as the app version, and the Bitrise build number as the build number. No need to use plistbuddy to fiddle with these values.
Conclusion
This process took about four months, with a little bit of work being done each sprint, about a person-day each week. What resulted was:
- A huge savings in time for developers, with build times cut in half locally and on Bitrise.
- Fewer failed builds means no more rebuilding PRs just to get it to pass.
- Higher confidence in our code – Danger lets us know when a pull request doesn’t contain enough coverage.
- Higher confidence in our storyboards and UI code – snapshot tests tell us if a pixel so much as thinks about getting out of line.
- Automated and repeatable builds, where no developer intervention means fewer mistakes!
Our team is in a happier place now. Why not gather your developers together, write down all the things that bother them about your build systems, rank them by how much time they waste every sprint (or week), and then tackle one at a time?