
- PagerDuty /
- Blog /
- PagerDuty University /
- Get to the Root (Cause Analysis) in 5 Easy Steps
Blog
Get to the Root (Cause Analysis) in 5 Easy Steps
by PagerDuty University
August 10, 2022
| 5 min read
What is one of the first things you should do when you are assigned an incident via PagerDuty? If you immediately thought “Acknowledge!” you are not wrong, but after that, it’s all about resolving the issue as quickly and painlessly as possible. The first step to resolution is to investigate what caused the incident in the first place so you can easily get a fix in place.
In the PagerDuty platform, Root Cause Analysis* refers to a set of features that aims to provide you, the responder, with as much context and actionable intelligence as possible. By surfacing past and related incidents, as well as insights into incident frequency, responders will have tools to quickly gain the situational awareness they need to determine probable root cause and speed up triage, and ultimately resolve faster. Likely origin points based on historical data will also be highlighted to help add context.
Here are the five places on the incident details page to help you investigate the potential root causes:
- Outlier Incident
When first opening an incident, look for the Outlier Incident classification label. This label is located directly under the incident name and will have a classification label of “Frequent,” “Rare,” or “Anomaly.” Based on this classification label, you can quickly gauge whether this incident has occurred before and how you might respond to it based on past experiences. Hover over the label to read their definitions.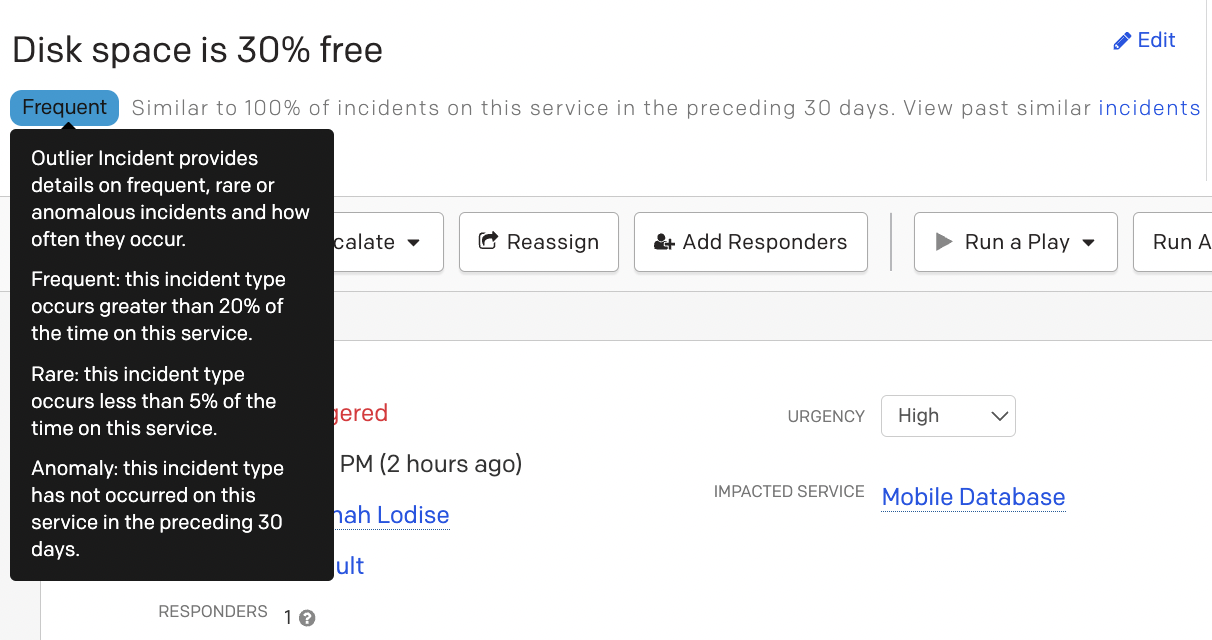
- Past Incidents
Once you have determined the frequency at which the incident has occurred on the service, navigate to the Past Incidents tab further down the page. A heat map is displayed to show when previous incidents like this open incident have occurred over the last six months. Look for patterns in the colors – darker colors equal higher concentration of incidents – or hover over the heatmap colors to see further details about the relevant incidents. Below that are details about the Top 5 past incidents like the open incident (if there are any!) along with information about when they occurred and who last changed the incident. Note: That person would be a great resource if you want to ask them about what they did/see their notes on the incident! To open up the incident details page for any past incident, click on the hyperlinked title.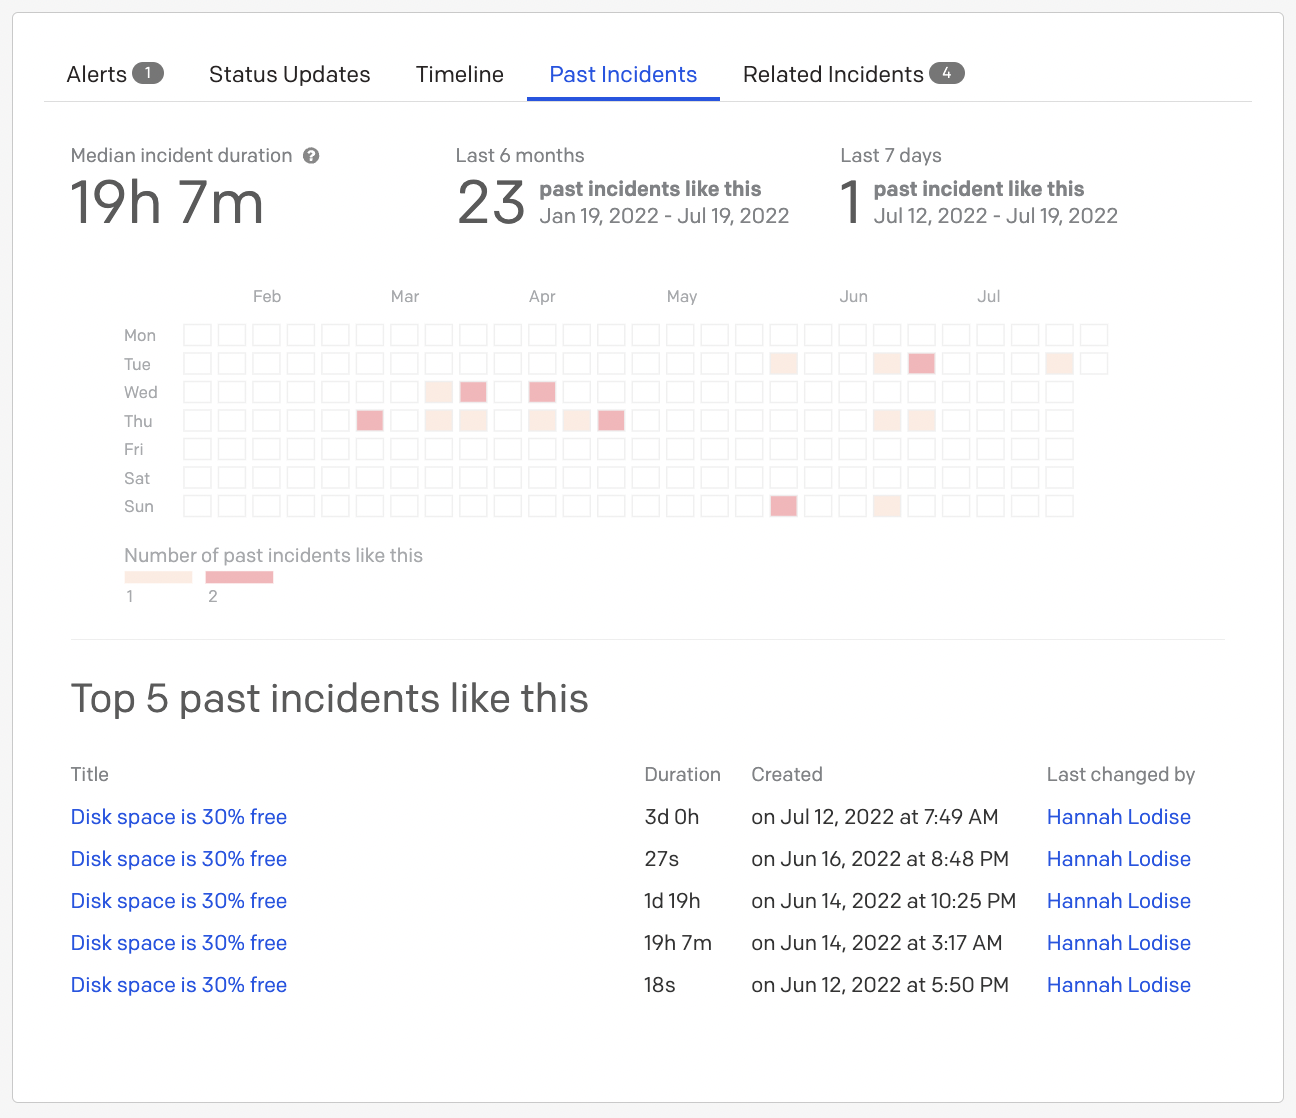
- Related Incidents
Another quick source of information is the Related Incidents tab. Here you see if there are currently any ongoing incidents that might be related to your issue from across all services, unlike Past Incidents, which only shows similar incidents on the same service. Understanding the scope of an incident across the business (is this isolated or part of a larger problem?) can help you understand the impact and to quickly identify who you need to collaborate with to fix the problem.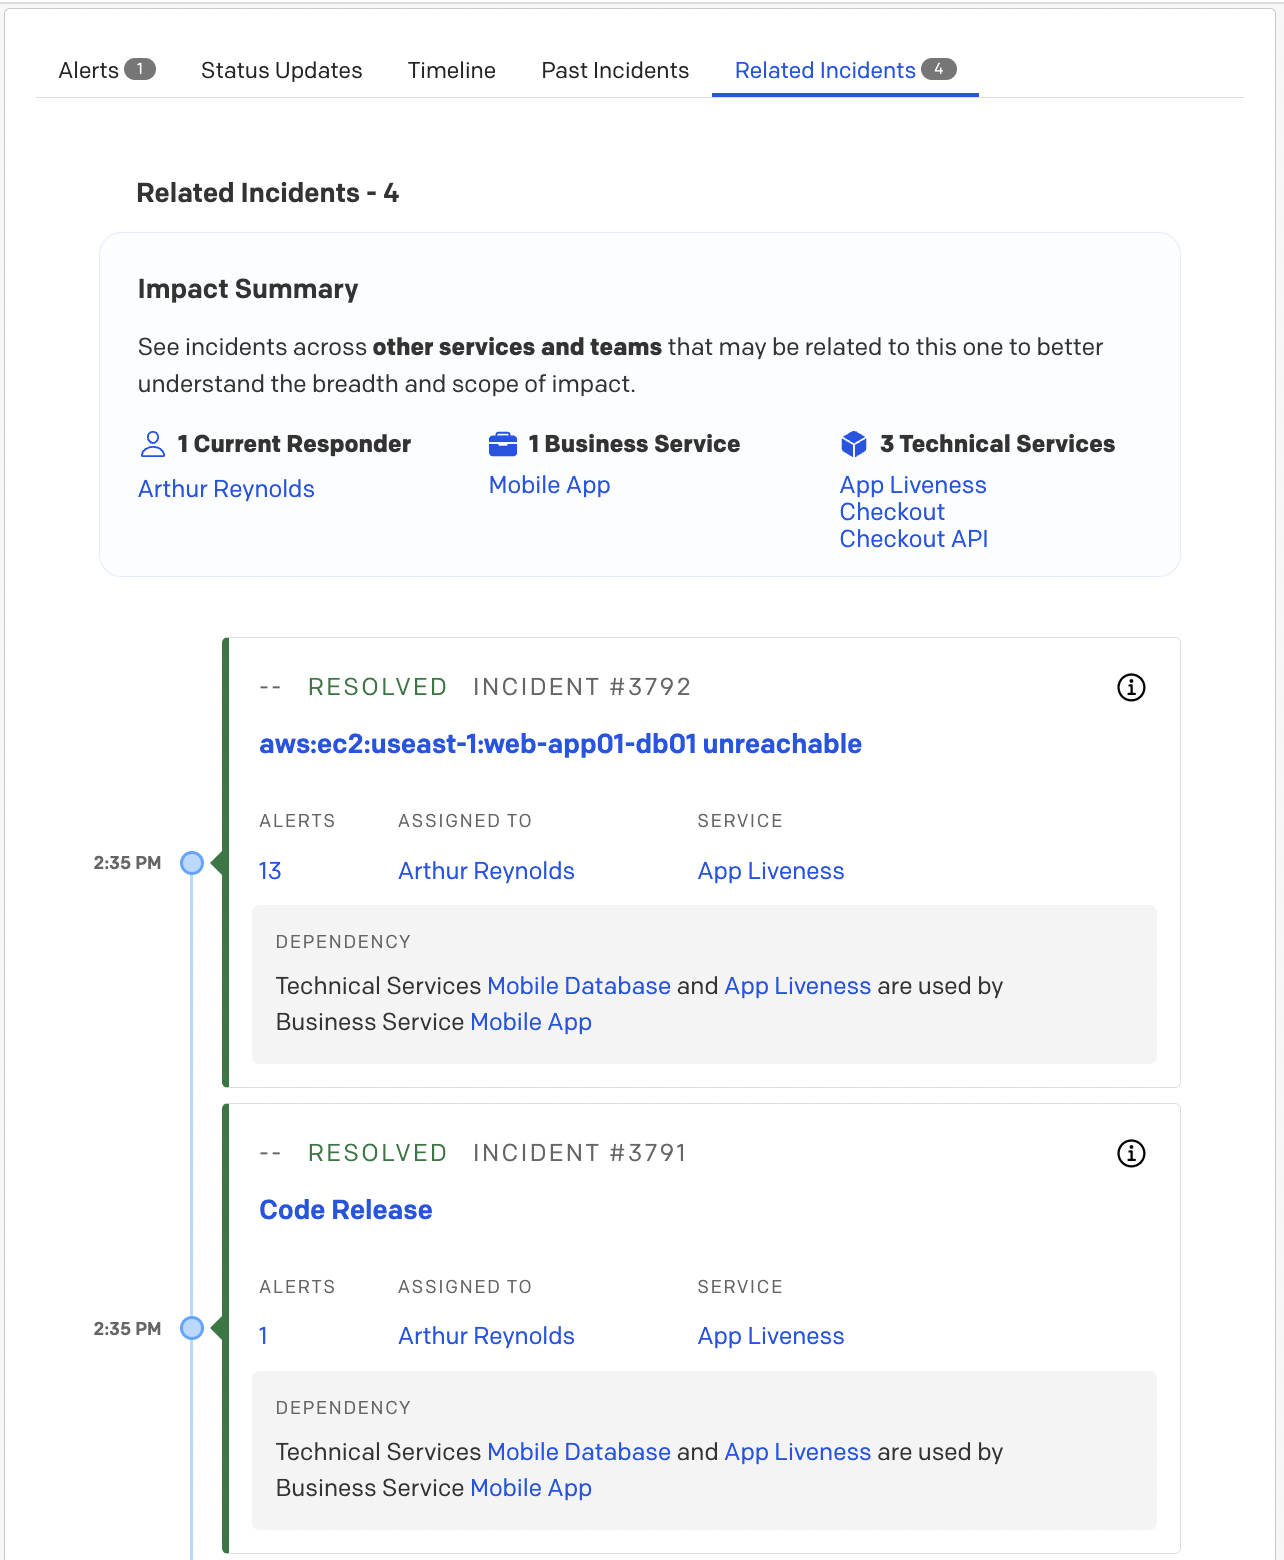
- Probable Origins
Jump start your triaging efforts with the Probable Origins widget located on the incident details page. This widget will calculate the likely origin percentage based on historical data, like whether the incident occurred directly before or after a similar event to the current open incident.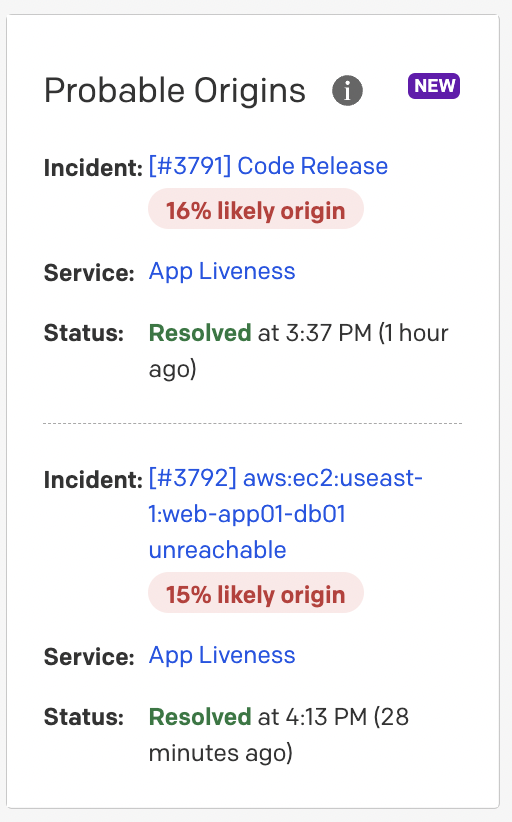
- Change Correlation
Lastly, it can greatly accelerate resolution when you are aware of any changes to your infrastructure or code that might have caused the incident. Change Correlation, displayed under Recent Changes on the incident detail page, shows the three recent change events that are most relevant to an incident based on time, related services, or PagerDuty’s machine learning. The recent change events will indicate why the platform surfaced the event, helping you to easily narrow down potential causes.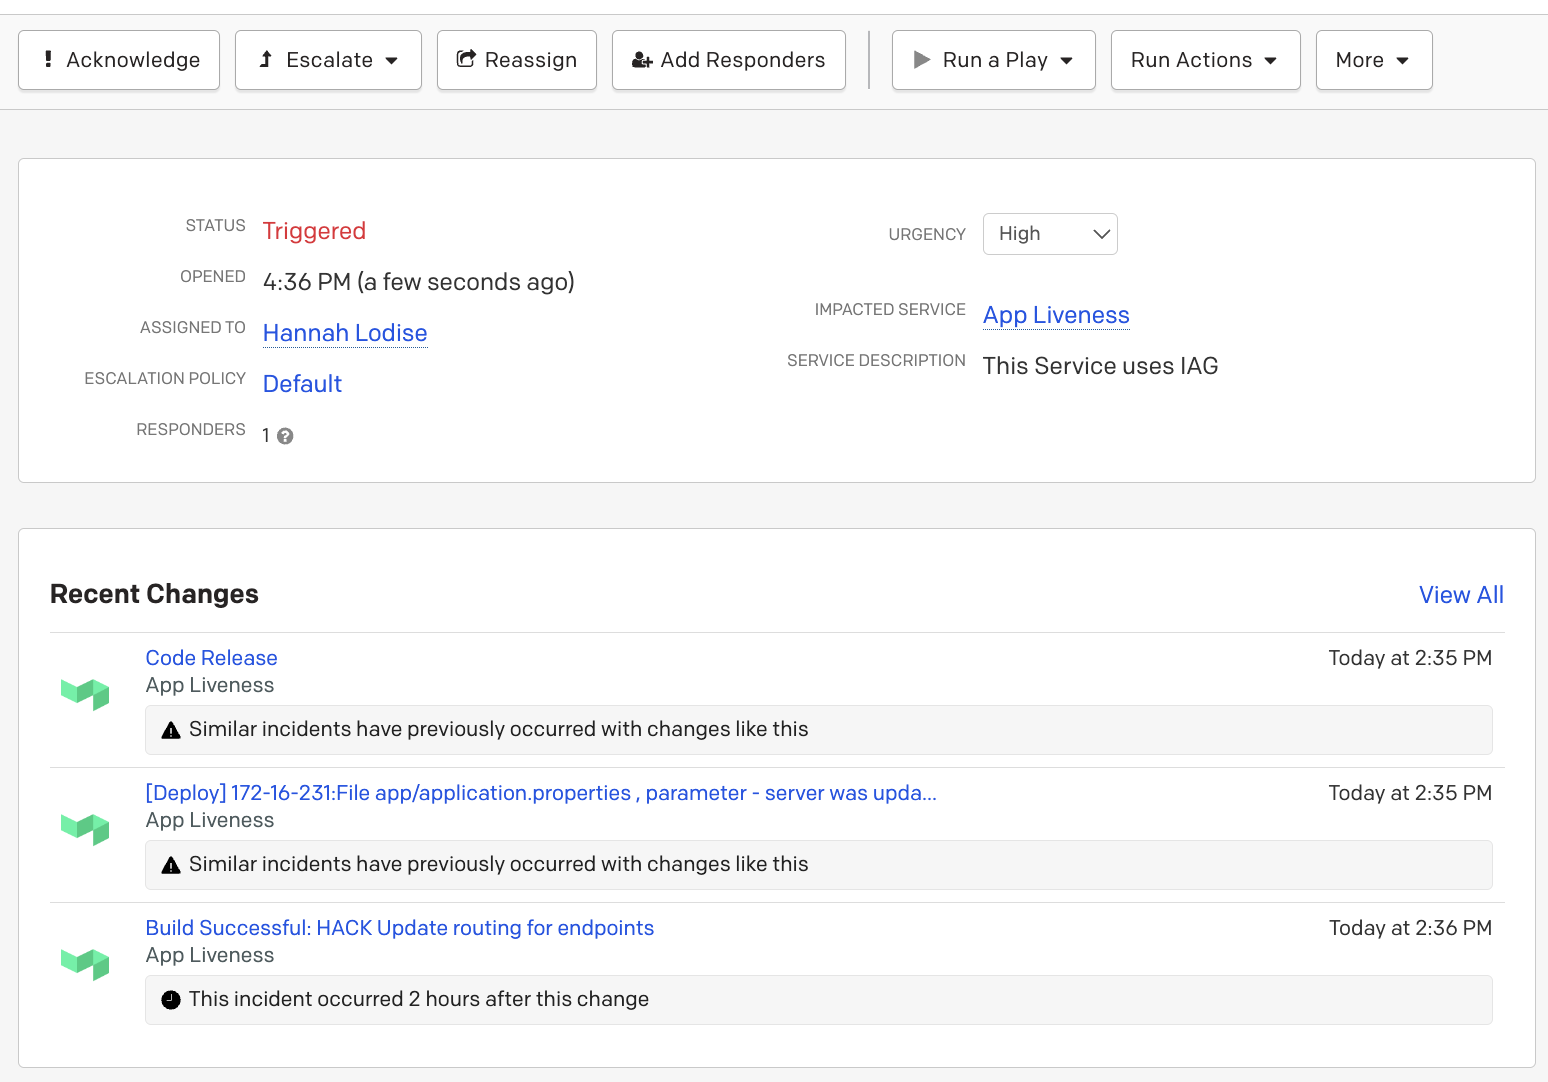
Knowledge check! True or false: The Past Incidents tab displays Resolved Incidents from the same service, while Related Incidents will display only Open Incidents on other services. (see answer at the bottom of the page)
How’d you do? Remember, these are five places you can look, to quickly gain context and jumpstart your triaging efforts.
To solve incidents faster and help reduce downtime further, combine this set of Root Cause Analysis features with Noise Reduction and Event Orchestration capabilities. If you need a refresher, take PagerDuty University’s Event Intelligence courses and then show off your ability to work smarter, not harder, by completing the Event Intelligence Certification!
Resources for Next Steps:
Event Intelligence Courses can be found on the PagerDuty University eLearning Portal.
- Noise Reduction
- Event Orchestration
- Root Cause Analysis
Event Intelligence Certification Exam information can be found on this page under “Specialty Product Certification.” As a celebration of this new series launching, we are offering complimentary registration for the exam for 30 days, so register now!
*Footnote: While we refer to this category of features as Root Cause Analysis, PagerDuty is not predicting or identifying root cause. Rather, our features help to create context around incidents to drive faster resolution. It’s also worth noting that there has been an industry shift to adopt the term probable or proximate cause rather than suggesting that there is any one true “root cause.”
Knowledge Check Answer: False. While the statement is correct that Past Incidents only displays resolved incidents from the past that were on the same service, Related Incidents will look at other active incidents – open and recently resolved – across ALL services (including the service your current incident is on) to find if any incidents are related to your current incident.