- PagerDuty /
- Blog /
- Integrations /
- Monitoring Social Signals to Reduce Alert Fatigue With SignalFx and PagerDuty
Blog
Monitoring Social Signals to Reduce Alert Fatigue With SignalFx and PagerDuty
by Arijit Mukherji
September 19, 2018
| 6 min read
“I need to be notified if there’s a significant event ongoing with SignalFx.” This is what I tell my team. However, despite being the CTO of a monitoring company, creating the right set of alerts for me to stay informed of incidents in progress or potential issues was harder than it seemed at first glance.
Why?
While the advent of cloud and open-source technologies has enabled us to build software much more quickly, today’s environments are significantly more complex to monitor and manage for a number of reasons, including:
- The explosion in the number of compute instances to monitor (hosts, containers, functions).
- Services rarely emit “well-behaved” metrics and constantly change over time.
- The increasing amount of services that need to be individually monitored due to microservices architecture.
The result for many of us is a storm of false positive or redundant alerts. Alert fatigue not only hinders your team’s ability to find and address issues in real time—but when left unaddressed for long enough, it also destroys team morale and results in preventable outages.
Strategies for Reducing Alert Fatigue
Reducing alert fatigue starts with broadening one’s focus. While fine-grained measurement of metrics is extremely useful during troubleshooting and forensic analysis, the most actionable alerts rely on a combination of signals that create higher-level indicators of application health. In particular, you should consider:
Monitoring Populations, Not Individual Instances
Define and subscribe to per-service or per-population health indicators as opposed to alerting on the status of every individual component in your environment. For example, you could track the 99th percentile latency of an API call across service instances, the average CPU utilization for a given cluster of nodes, or the sum of API errors for a group of containers that serve it.
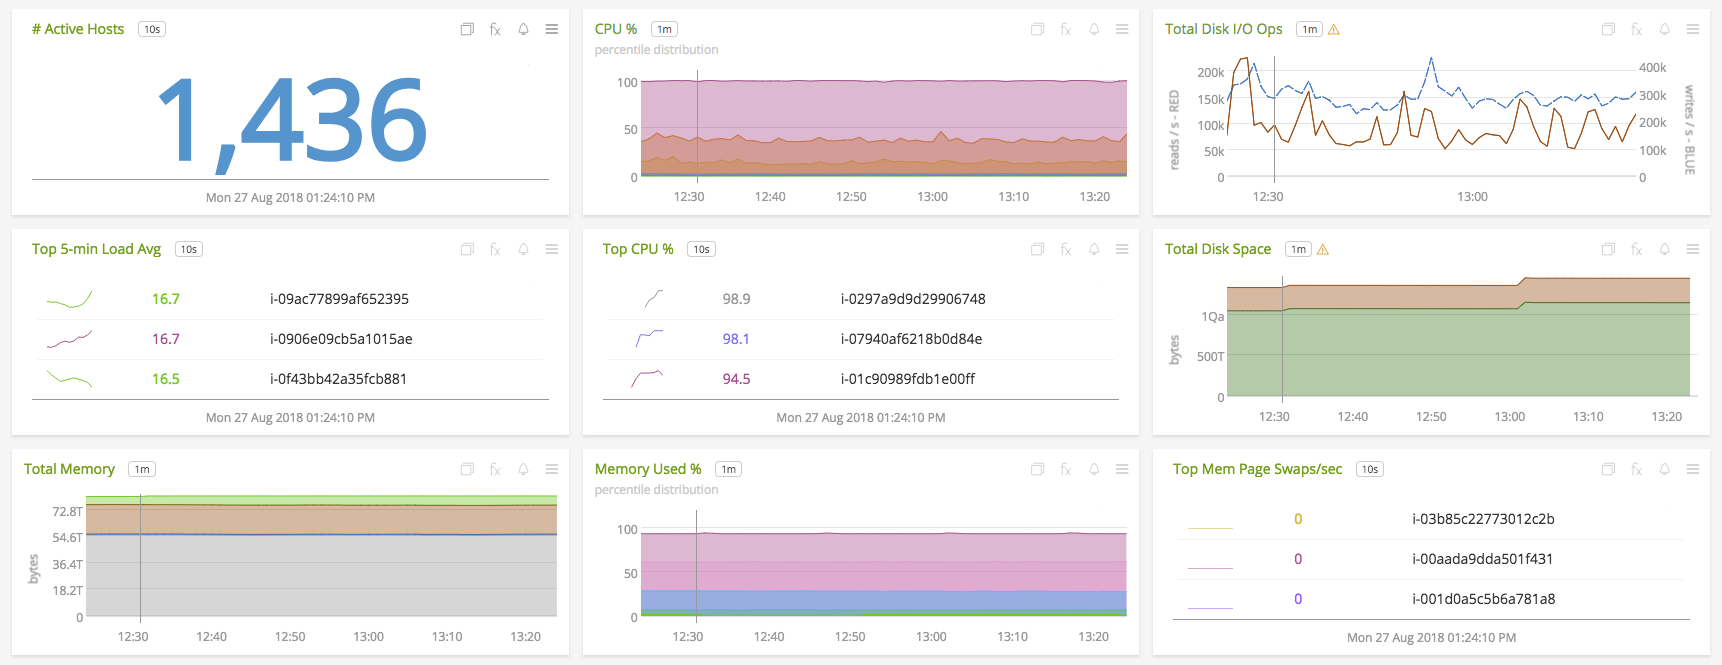
Aggregated system metrics across 1,436 hosts
Alerting on Patterns and Trends Rather Than Fixed Numerical Thresholds
Use algorithmically generated thresholds that can adapt to changing environments. Distributed systems often behave in mysterious ways, which makes it extremely difficult to determine the “right” amount of CPU usage or API errors that occur before an alert fires.
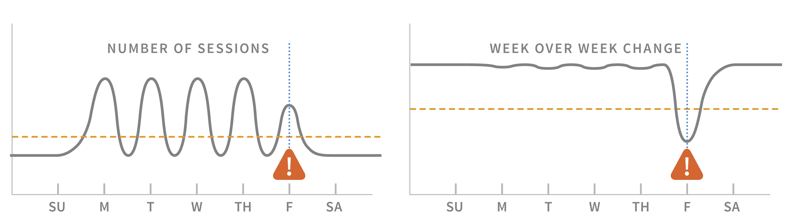
Alerting on raw # of sessions vs. week over week change
By accounting for regular patterns (e.g., higher weekday traffic) or predictively alerting (alert when a cluster is about to run out of disk space in the next N days), you can further differentiate between regular system behavior and something that warrants a response.
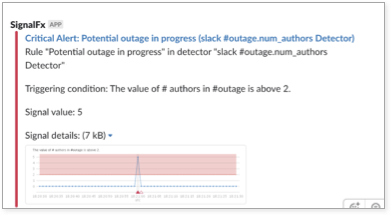
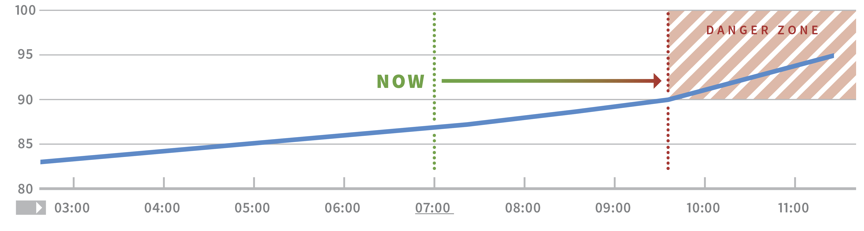
Chart displaying a metric trending to capacity
Defining Overall Measures of Application Performance
Combine metrics from different microservices to derive higher-level signals and alerts. Two possibilities are the number of page loads per logged-in user or the count of API errors measured as a percentage of total API calls. One of our customers combines metrics from all their microservices to create a “health score” for deployment versions that indicates whether application performance improved as a whole.
Measuring Social Signals
Despite the fact that we use all of these techniques at SignalFx, I was still experiencing too many false positive alerts. Keep in mind the following:
- As an engineering leader, I do not require alerting as fine-grained as a service owner or on-call engineer. Following just a subset of alerts is also impractical, as that subscription list gets quickly outdated without constant vigilance.
- Though our organization uses PagerDuty, I am not always on the on-call escalation path.
- While I could filter out minor issues by looking at sources like the SignalFx status page, this would deliver alerts too late (after a site issue is in full swing rather than before) for me to actively contribute to incident response.
What other signals could I measure? At SignalFx, we have a Slack channel that we’ve named #outage that’s specifically for discussing incidents. This channel also receives critical alert notifications from PagerDuty to preserve context for those discussions. Knowing that significant issues often cause multiple users to collaborate on Slack and escalate via PagerDuty, I decided to gather metrics on human activity in #outage. The result looked something like this:
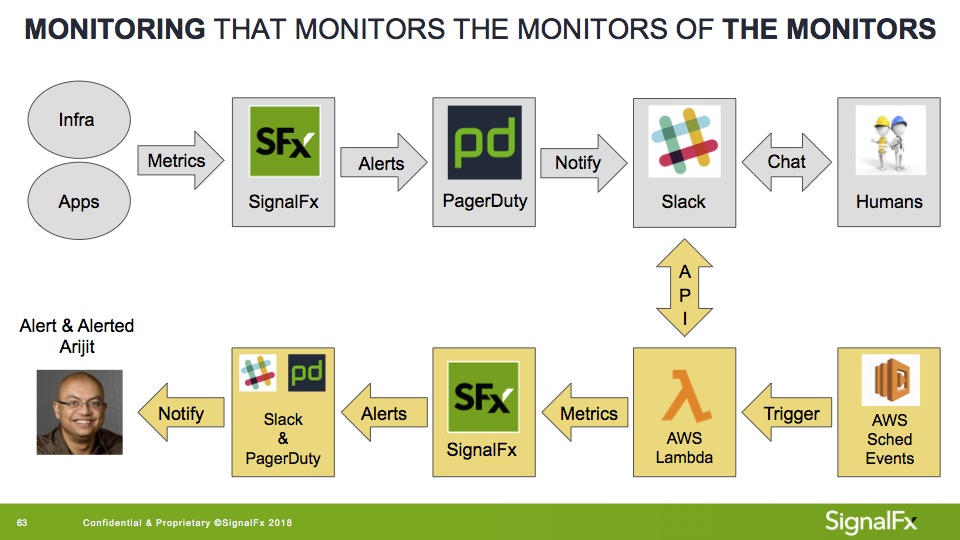
Gray: “Normal” SignalFx alerting workflow
Yellow: Alerting with social signals
I used an AWS Lambda set to query and classify messages (e.g., human vs bot-generated), then publish them to SignalFx. Next, I created an alert detector that notified me when more than three unique human authors were typing in #outage for a period of five minutes or longer. Alerts were sent to my phone via PagerDuty and a direct message in Slack.
Notification for potential outage in progress
This worked surprisingly well—while I still received a few false positives, the amount dropped to almost zero, and I was notified for every single incident of interest to me. Interestingly enough, I was also notified of a few potential incidents brewing that I had no active alerts set for, but our engineers had uncovered as part of their general observation of the service.
Don’t Stop Monitoring at Hardware and Software
I was initially disappointed at being unable to create the “perfect” alert using only application and infrastructure metrics, but this may have been a naive expectation. Crafting the right alert requires not only understanding your environment, but also how your organization responds to incidents.
Measuring human behavior was enough for my specific use case, but given how interoperable and data-agnostic many of today’s tools are, there are a wealth of other signals that we could potentially incorporate into our monitoring.
Integrate Problem Detection With Incident Management
Real-time business requires real-time operational intelligence, and today’s technologies emit far more data than traditional monitoring tools can handle. SignalFx collects streaming metrics from every component in your environment to provide analytics and alerts in seconds, so you can find and address issues before they impact customers.
With SignalFx and PagerDuty, you can automatically open incidents in PagerDuty when an alert detector is triggered in SignalFx, map to different escalation policies depending on the alert, and automatically mark incidents resolved when things return to normal.
At SignalFx, we help organizations monitor all the signals that matter—in real time, at any scale—and give them the confidence to innovate faster than ever before.
Arijit Mukherji is CTO at SignalFx and passionate about monitoring. He was one of the original developers of Facebook’s metrics solution (ODS), and subsequently managed the development of Facebook’s networking tools, data visualization, and other infrastructure monitoring software. While focused on the monitoring space for more than a decade, his diverse career of over 20 years also spans IP telephony, VoIP conferencing, and network virtualization.