
Three Key Takeaways from The State of Digital Operations Report 2021
by Hannah Culver
July 28, 2021
| 7 min read
2020 heralded a year of increased complexity and customer demands, which isn’t going away. In this new normal, organizations will still be tasked with keeping up this break-neck pace. So, what did digital operations look like in 2020 compared to 2019?
We developed our first inaugural platform insights report, The State of Digital Operations, to present an aggregated view of what we’re seeing across our platform in order to shed light into the volume of real-time work, its growth over time, and how that increasingly burdens technical teams. We wanted to understand the role of digital operations maturity in balancing the business impact, operational health, and human factors behind an organization’s approach to incident response. To generate this report, we analyzed aggregated, anonymized PagerDuty customer data from January 2019 to April 2021.
Some key findings:
- Incidents and noise show no signs of slowing down. With today’s businesses relying on hundreds and thousands of complex digital services to deliver critical customer experiences, those services need to stay always-on. But complex systems will break, and when they do, organizations need a scalable, sustainable approach to managing real-time incident response that won’t burn out their employees.
- Continued use and adoption of PagerDuty within organizations enables them to improve their digital operations over time. Looking at customers using PagerDuty over five years, there is a clear improvement of mean time to acknowledge (MTTA), mean time to resolve (MTTR) and rate of acknowledgement (Ack%) over time.
- Over a third of users worked a considerably less consistent schedule in 2020 than in 2019, the equivalent to working two extra hours per day. Humans ultimately sit at the center of incident response and need help balancing the growing volume of real-time work. Staying cognizant of overwork that might be happening at organizations is critical for business and technical teams alike.
- Not managing burnout can result in attrition. Our data science team found a statistically significant correlation between users leaving the platform and how often they were involved in off-hour incident resolution. In other words, the more frequently users are involved in fixing problems off hours, the more likely they are to quit.
Let’s take a deep dive into some of the most interesting takeaways from this report.
Incident Volume is Up, as are Customer Expectations
A team’s operational maturity determines how well it responds to and recovers from incidents. The bottom line isn’t the only thing impacted by incidents. Trust, brand loyalty, and customer confidence are all at risk as well. As incident volumes increase, this will only get more significant.
Data shows that critical incident volume across the platform rose 19% from 2019 to 2020. Critical incidents are defined as those from high-urgency services, not auto-resolved within 5 minutes, but acknowledged within 4 hours and resolved within 24 hours. From 2019 to 2020, companies with over $1B in revenue (what we label as enterprise) and very small businesses (those with less than $10 million in revenue) experienced an increase in critical incidents of 14% and 16% respectively.
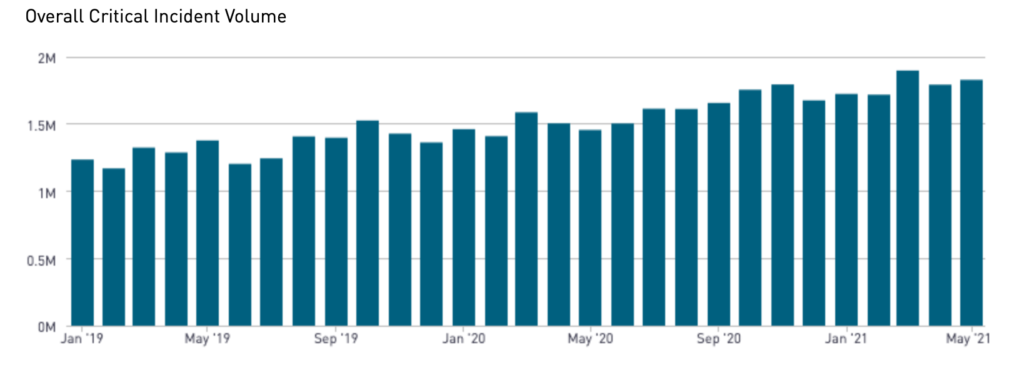
As the pressure to meet customer needs continues to grow, this number is only expected to rise. Even as people return to the office, eat in restaurants, and socialize in person, many of the digital services we relied on during 2020 will remain staples.
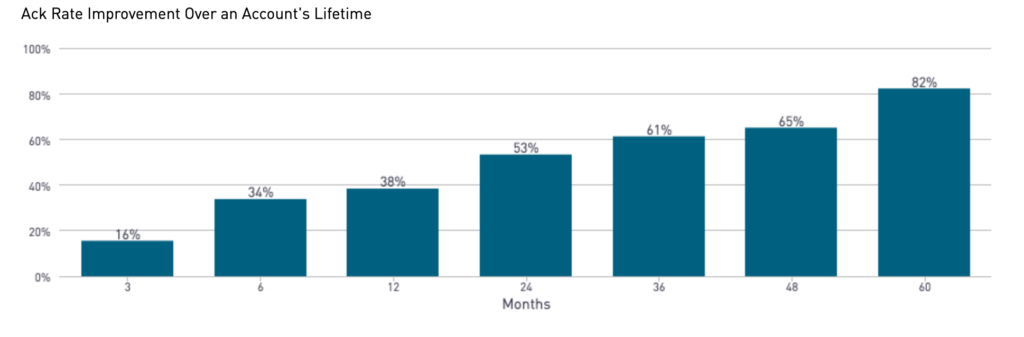
Teams are Improving on MTTA and Ack%
You’ve heard it before: uptime is everything. When a service is disrupted, service owners need to be on the scene as quickly as possible. Acknowledging incidents faster and more frequently helps teams avoid a “tragedy of the commons” where issues are ignored and each team assumes that someone else will handle them.
We looked at accounts that have been using PagerDuty over five years, and it’s clear that they are getting better at incident response as they continue using the platform. Even with performance cohorts split out, with the 10th percentile being nearly twice as fast at acknowledging incidents compared to the 25th percentile, all accounts are seeing improved MTTA over time.
Ack% has also improved. We use this metric as a proxy for the level of responsibility and accountability in an organization. High-performing teams take ownership and acknowledge issues quickly, even if it may take some time to investigate and resolve them.
More Off-Hour Interruptions Can Lead to Burnout and Attrition
We also found that over a third of users worked a considerably less consistent schedule in 2020 than in 2019, the equivalent to working two extra hours per day. This is significant, totaling an extra 12 weeks of work over the course of a year.
We looked at interruptions for responders just in the US, normalized to the user’s timezone, to see when they happen. Compared to 2019, organizations saw 4% more interruptions in 2020. However, when digging into the spread across time categories, there was a 9% increase in off-hour interruptions and a 7% lift in holiday/weekend hour interruptions, compared to 5% increase in business hour interruptions and 3% decrease in sleep hour interruptions.
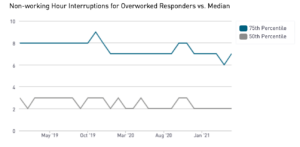
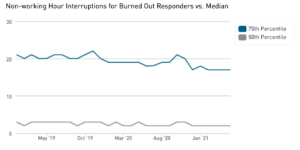
We then split the analysis of off-hour interruptions (meaning outside of their normal working hours, like during the evening or night, weekends, or holidays) for these responders in 2020 into several cohorts to gauge a healthy responder versus an overworked responder, and what we’re calling a burned-out responder. Here are how the percentiles are broken down:
- The Good (50th percentile): The median is two non-working hour interruptions a month per user.
- The Bad “Overworked” (75th percentile): Responders have seven non-working hour interruptions a month—over 3x as many interruptions vs. the median responder per month.
- The Ugly “Burned Out” (90th percentile): Responders have 19 non-working hour interruptions a month on average. That’s almost 3x as many non-working hour interruptions per month as the Overworked responder, and 10x that of the median responder per month, a phenomenon that gets worse for smaller companies.
We saw that users leaving the platform (our proxy for attrition) experienced higher-than-average off-hour incident loads. From this, we can deduce that the more off-hour incidents users handle, the more likely they are to burn out, and the more likely they are to leave. At a time when employee burnout and attrition is top of mind for companies competing for high quality talent amidst the Great Resignation, it’s especially important to invest in establishing processes and reinforcing a culture that helps to balance workload and protect morale for the technical teams keeping your digital services up and running.
Bringing it all Together
From this report of PagerDuty platform data, we were able to see that as companies continue to accelerate their digital efforts, they will need to consider:
- Complexity, noise, and incident volume have all increased over time and show no sign of slowing down.
- Critical incidents require real-time work to address and resolve, placing direct stress on responders and work-life balance.
- Operational processes and intelligent platforms can help alleviate the pressure on teams and empower organizations to unlock faster MTTA and MTTR, and more.
Every company needs a sustainable way to allocate resources to manage incident response, not only to keep a strong digital presence and provide a delightful customer experience, but also to retain its employees. In the end, it’s humans–the ones who build and manage the digital applications and infrastructure that businesses and customers rely on – who are at the core of managing ever-increasing noise and complexity .
Companies that excel at digital operations management throughout the real-time work lifecycle, the ones that can balance the workload for their people to keep them happy and productive, will be best positioned to deliver the highest quality customer experiences and mitigate risk for their business.
If you’re interested in more of our insights, you can download the full report here. We’ll also be hosting a webinar to unpack key findings. To learn more, register here.