
- PagerDuty /
- Blog /
- Monitoring /
- Smart SLO Alerting With Wavefront
Blog
Smart SLO Alerting With Wavefront
by Pontus Rydin
November 7, 2019
| 9 min read
SLOs Just Became Important
Back in the good old days of monolithic applications, most developers and application owners relied on tribal knowledge for what performance to expect. Although applications could be incredibly complex, the understanding of their inner workings usually resided within a relative few in the organization. Application performance was managed informally and measured casually.
However, this model falls apart in a microservices world. Using informal methods, a single team or small group can no longer see the full picture of an application and, therefore, can’t deduct its performance. This is because the chains of services can be very deep, and a lack of understanding about the performance of the downstream components can result in unwelcome surprises that ultimately affect both the end-users and the business.
So What’s an SLO?
Before we go any further, let’s define a Service Level Objective (SLO), along with some related concepts and acronyms.
SLIs Are What We Measure
A Service Level Indicator (SLI) is a quantity we measure to determine whether we comply with an SLO. Very commonly, SLIs measure either the success rate or performance of some operation, but an SLI can be just any metric.
SLOs Make SLIs Actionable
For an SLI to be interesting, it needs to be associated with a condition. For example, we can state that 99% of all operations must complete successfully or that 95% of all transactions must finish within one second. We often express SLOs as a percentage over some time. For example, we may measure the 99% success rate over 24 hours, and the 95% latency performance better than one second may be measured over an hour.
An SLO should be Attainable, Repeatable, Measurable, Understandable, Meaningful, Controllable, Affordable, Mutually Acceptable.1 For example, a transaction success rate of 99.9999999% may not be attainable because commercially available hardware can’t offer that level of reliability. Similarly, an SLO based on some obscure technical metric is probably neither understandable nor meaningful to most users.
SLAs Are SLOs With an “Or-Else” Clause
While SLOs are actionable, Service Level Agreements (SLAs) make them enforceable from a legal standpoint. SLAs typically attach a monetary penalty to the SLO, saying, for example, that if we don’t meet our SLO for a customer, we may be required to pay back a certain percentage of the money they spent with us. Typically, as technologists, we don’t have to worry as much about SLAs since it’s something our lawyers deal with.
Implementing Good SLOs
A good SLO, it turns out, isn’t as straightforward to implement as one might think at first glance. A naive approach might be to measure deviation from “good” over some time and alert on that. This simple approach suffers from a whole range of drawbacks. The following discussion draws from best practices in the Google SRE Handbook. Let’s explore how these ideas can be used to implement useful SLOs with Wavefront!
Picking the Right SLI
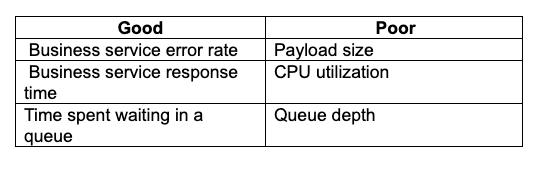
Selecting the right metric as the basis for an SLI is an art in itself and worthy of a separate article. As a rule, we should pick a metric that is meaningful to the business and actionable. Good metrics include error rates and the performance of business services. Poor ones include purely technical metrics and metrics that don’t map to an actionable result. Here are a few examples:
Error Budgets
Nobody’s perfect, so we need to allow ourselves some room for error. A system with 100% uptime isn’t realistic, so we need to make a tradeoff between our desire to provide a reliable system and the resources that are available. Setting our expectations for availability too high is one of the worst mistakes we can make. It results in constant alerts that people eventually ignore, and that will mask the real issues.
So we need to determine how much time over a certain period we allow ourselves to be out of compliance. This is typically expressed as a percentage. For example, we may allow ourselves to spend 1% of our time out of compliance. Usually, we turn this percentage around as an availability number, so in the case of a 1% error budget, we say we expect 99% availability.
SLO Windows
The next issue is the time frame to measure. We say we allow ourselves to be out of compliance 1% of the time, but over what time frame? Selecting this time frame turns out to be a hard problem to solve. If we measure over a very short time, say 10 minutes, then insignificant glitches will constantly trigger alerts. Alternatively, if we measure over a longer time period, say 30 days, then we will be alerted too late and risk missing severe outages altogether.
Burn Rates
Let’s say our contract with our users states 99.9% availability over 30 days. That works out to an error budget of 43 minutes. If we burn down these 43 minutes in small increments of minor glitches, our users are probably still happy and productive. But what if we have a single outage of 43 minutes at a business-critical time? It’s safe to say our users would be pretty unhappy with that experience!
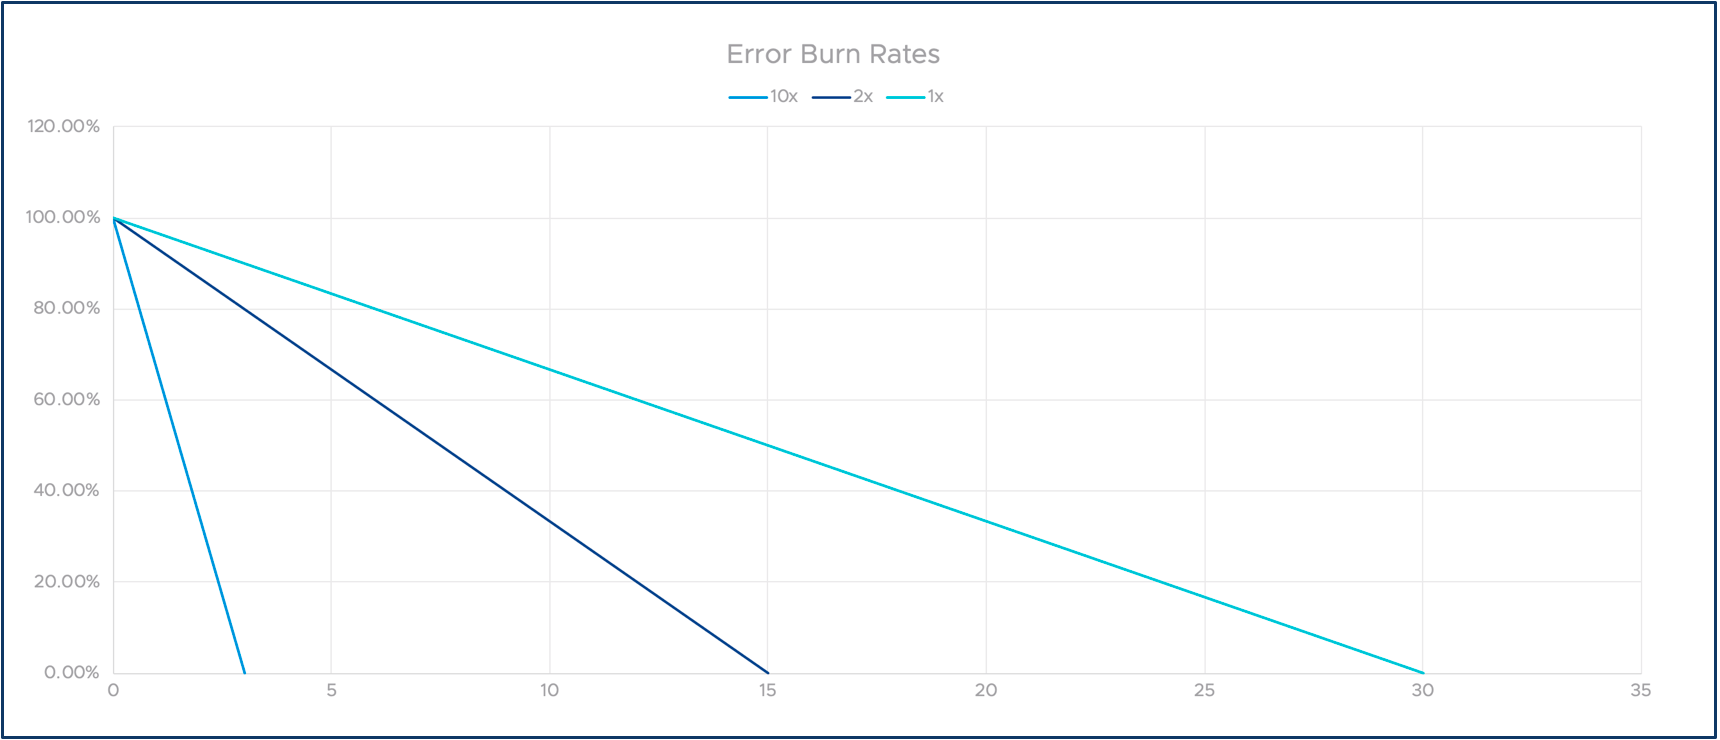
To solve this, we can introduce burn rates. The definition is simple: If we burn down precisely 43 minutes in our example over 30 days, we call this a burn rate of one. If we burn it down twice as fast, e.g., in 15 days, the burn rate is two and so on. As you will see, this allows us to track the long-term compliance, and to alert on severe, short-term issues.
The following graph illustrates the idea of multiple burn rates. The X-axis represents time and the Y-axis is our remaining error budget.
Putting It All Together
Now let’s take what has just been explained and put it together into a useful solution for SLO monitoring and alerting!
We learned that long-term monitoring of an SLO trend and short-term alerting must be done using different methods. We’ve also introduced the idea of burn rates. So how do we turn this into a great SLO alerting solution?
Multiple Windows?
One idea is to use multiple time windows for immediate alerts and longer-term trend observations. The problem is that if we select a one hour window, a 99% objective allows only 36 seconds of non-compliance. For a 99.9% objective, that number drops to 3.6 seconds! This would cause a lot of noisy alerts for minor glitches.
Multiple Windows, Multiple Burn Rates
One way to overcome this problem is to employ the burn rates we previously discussed above. If we are looking at a shorter time window, we measure against a faster burn rate. This allows us to fire alerts when a service has been unavailable for a meaningful amount of time. When we monitor over a longer time window, we use a slower burn rate to catch worrisome trends. The following table illustrates how this can be done.
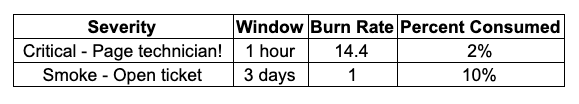
This means that if we’re burning our error budget at a rate of 14.4 during an hour window, we should have fired off a critical alert. We select 14.4 because it represents a burn of 2% over an hour.
On the other hand, if we see a slow burn over a longer time, it may not have a severe impact on users, but it means that we’re on track to breach our SLO over a longer time. The first alert should cause someone to be paged immediately, while the second one can be a lower priority alert that someone can look at when they have time.
How Wavefront Helps
As we have seen, implementing a good SLO is relatively hard. You need to do a fair amount of math and make complex decisions. For that, you need a tool with an advanced analytics engine, a rich query language, and flexible alert creation capabilities. In other words, you need Wavefront!
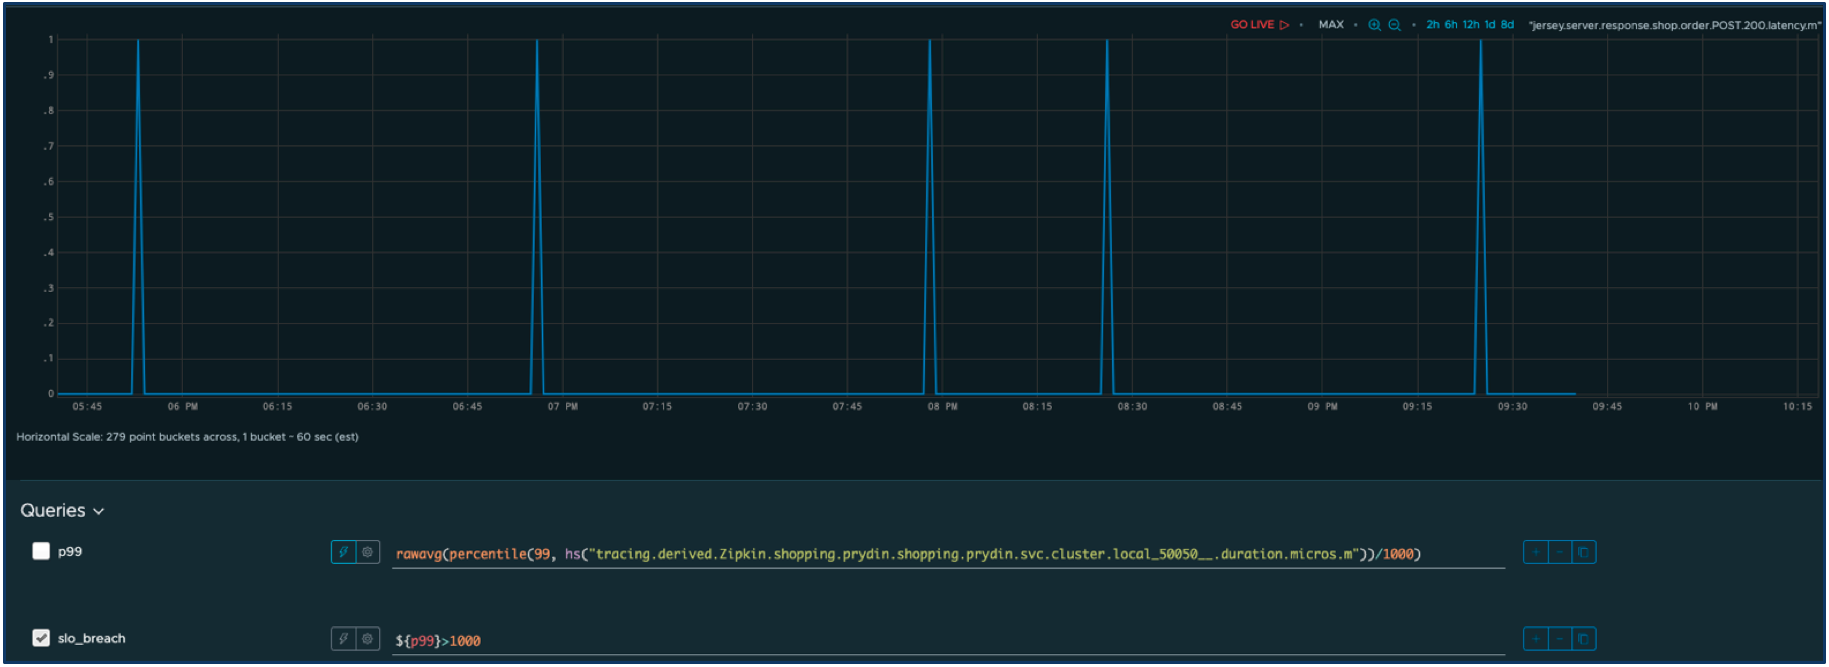
Let’s say we have an SLI for the response time for some service. Here’s the time series for our SLI metric.
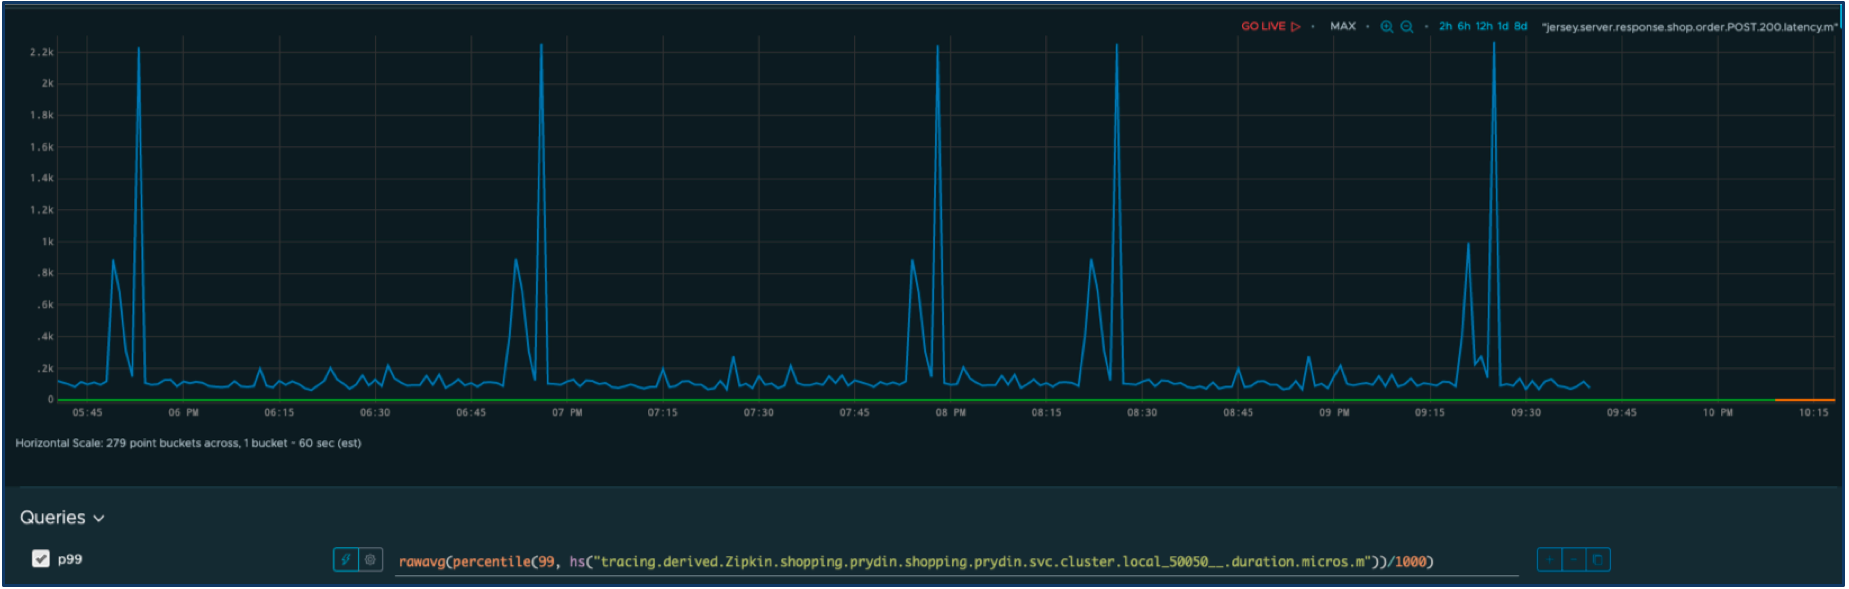
Let’s define acceptable performance as a response time less than one second. Anything else will be considered as an outage that negatively impacts users. We can easily modify the query to filter out only the outages.
Now, we define two windows—one short-term window with an aggressive burn rate and one longer-term window with a slower burn rate. We can now calculate the adjusted burn rate over time for both windows.
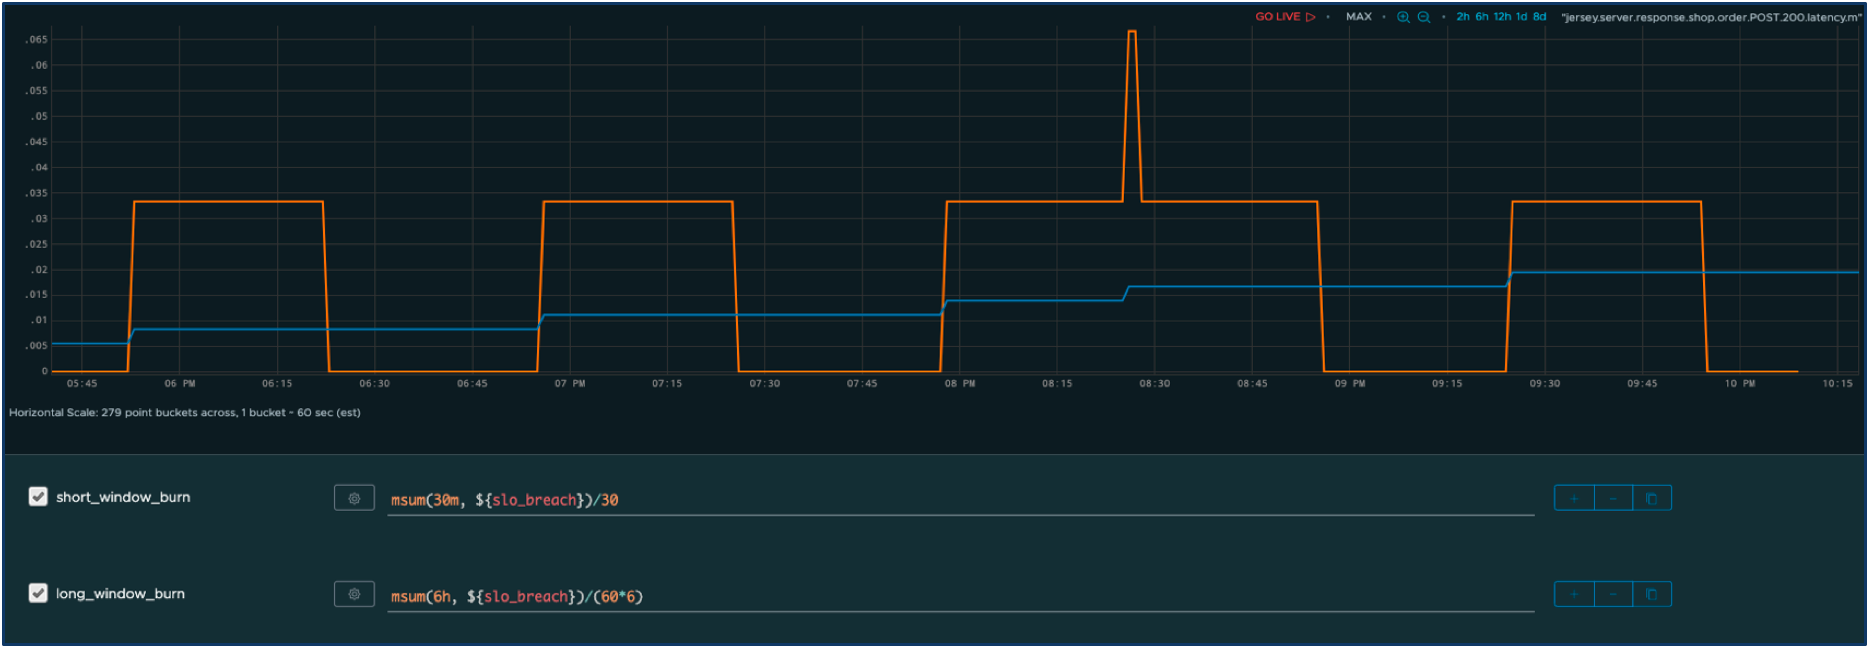
The orange series represents the cumulative outage time over the shorter window and the blue series over the longer window. As you can see, the spikes in response times have an immediate impact on the short window, but they also contribute to a slow incremental change on the longer-term burn. Furthermore, thanks to the burn rate multiplier, we suppress alerts resulting from any insignificant glitches.
Let’s click on the “create alert” button in the Wavefront UI and define an alert that fires when one of the windows has burned through its allotted error budget.
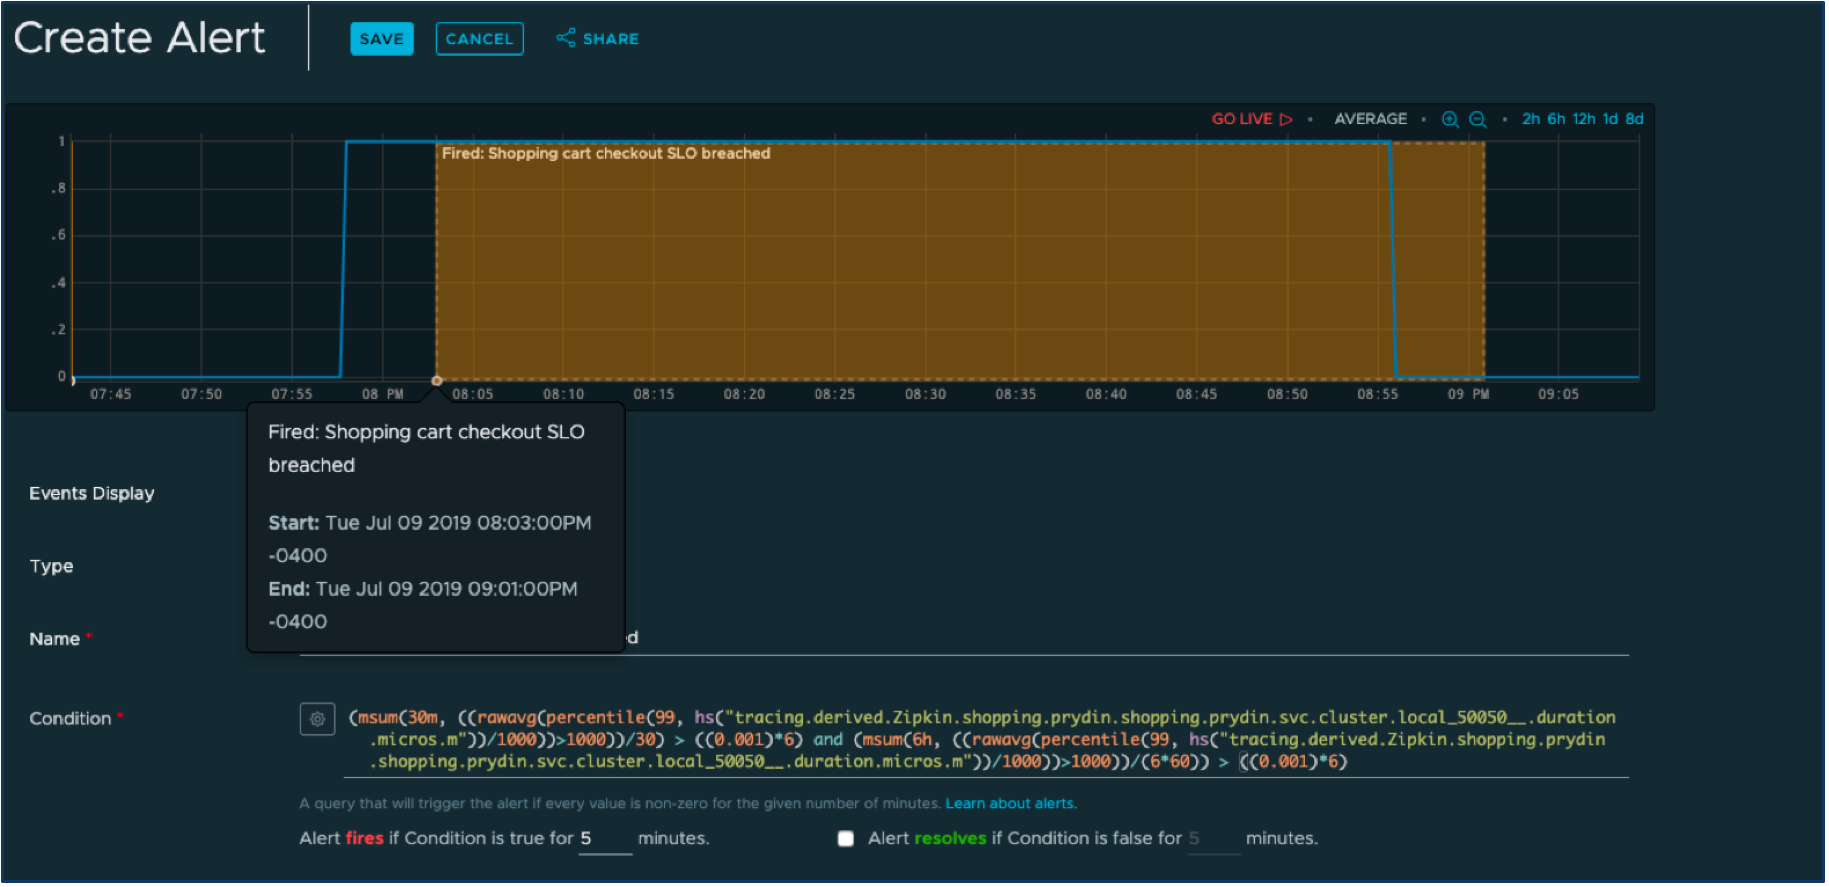
The complex-looking query at the bottom is synthesized from the set of much simpler queries we already defined.. All we have to do now is to select the alert notification mechanism, such as PagerDuty (there is a great out-of-the-box integration between Wavefront and PagerDuty), and we can expect to quickly find out when we’re in danger of no longer meeting SLOs.
Conclusion
In this blog, we’ve seen that alerting on an SLO is fairly complex. But thanks to the query language and alerting mechanisms in Wavefront, we can build smart SLO alerts in minutes.
In a real-life scenario, there are additional techniques that can employ to refine the alerts even further. For example, we may want to use multiple windows per burn rate. If you would like to learn more about this, the Google SRE Handbook is a good place to start.
To learn more about the Wavefront Enterprise Observability Platform, check out our free trial today.
1. Rick Sturm, Wayne Morris “Foundations of Service Level Management,” April 2000, Pearson
About the Author
Pontus Rydin has worked with IT management and operations solutions for the last decade and has an extensive background in software development and applications management. He now holds a position as a Technology Evangelism Director and Developer Advocate for Wavefront by VMware. His overarching mission is to help developers and SREs gain insight and control over their applications to increase business performance while reducing risk. Pontus spends his days working on anything from open source contributions, speaking directly to customers, and at conferences sharing thought leadership through various digital channels.
You may also love these...