
- PagerDuty /
- Blog /
- Operations Performance /
- You've got data. Now what?
Blog
You've got data. Now what?
by Vivian Au
July 31, 2014
| 4 min read
Guest blog post from Angel Fernández Camba, Developer at Logtrust. With Logtrust you will view all your business insights in dashboards and get alerts on any parameter you need, always in real-time.
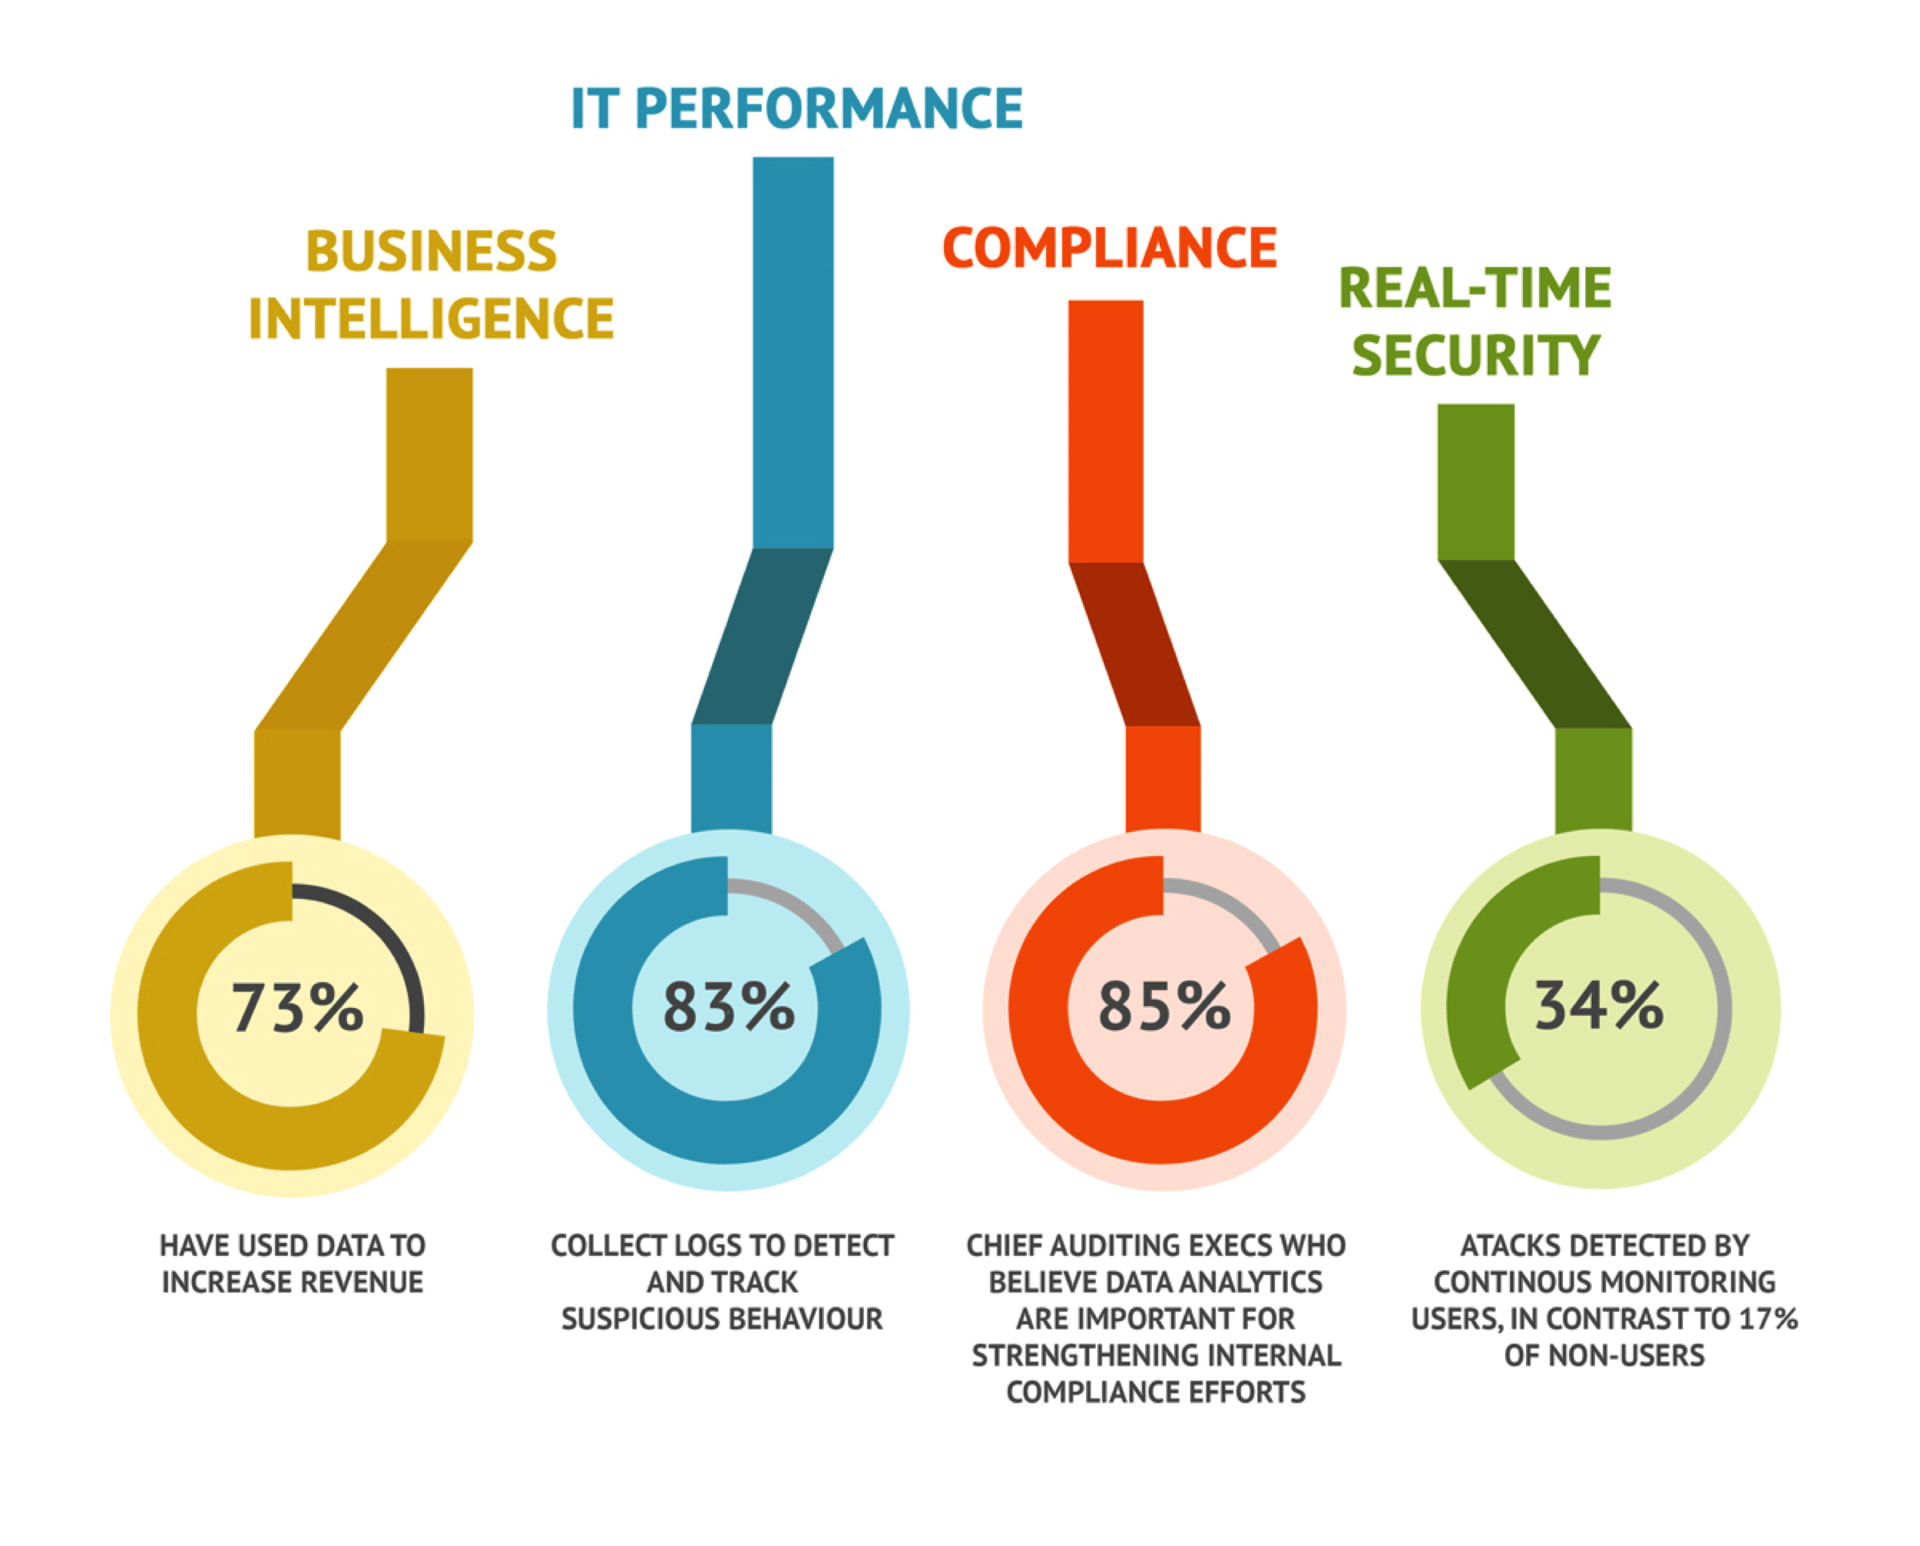
Companies don’t have to search far and wide to find ways to increase their top line revenue. Many are sitting on a wealth data waiting to be analyzed. But how exactly do you turn data into money? The answer is simple, logs. Logs are events that happen inside a server, application, and firewall and they contain a lot of interesting information that every department within a company can use. Marketing can filter the data to discover new sources of revenue while IT teams can detect and track suspicious behavior in real-time to eliminate downtime and increase customer loyalty.
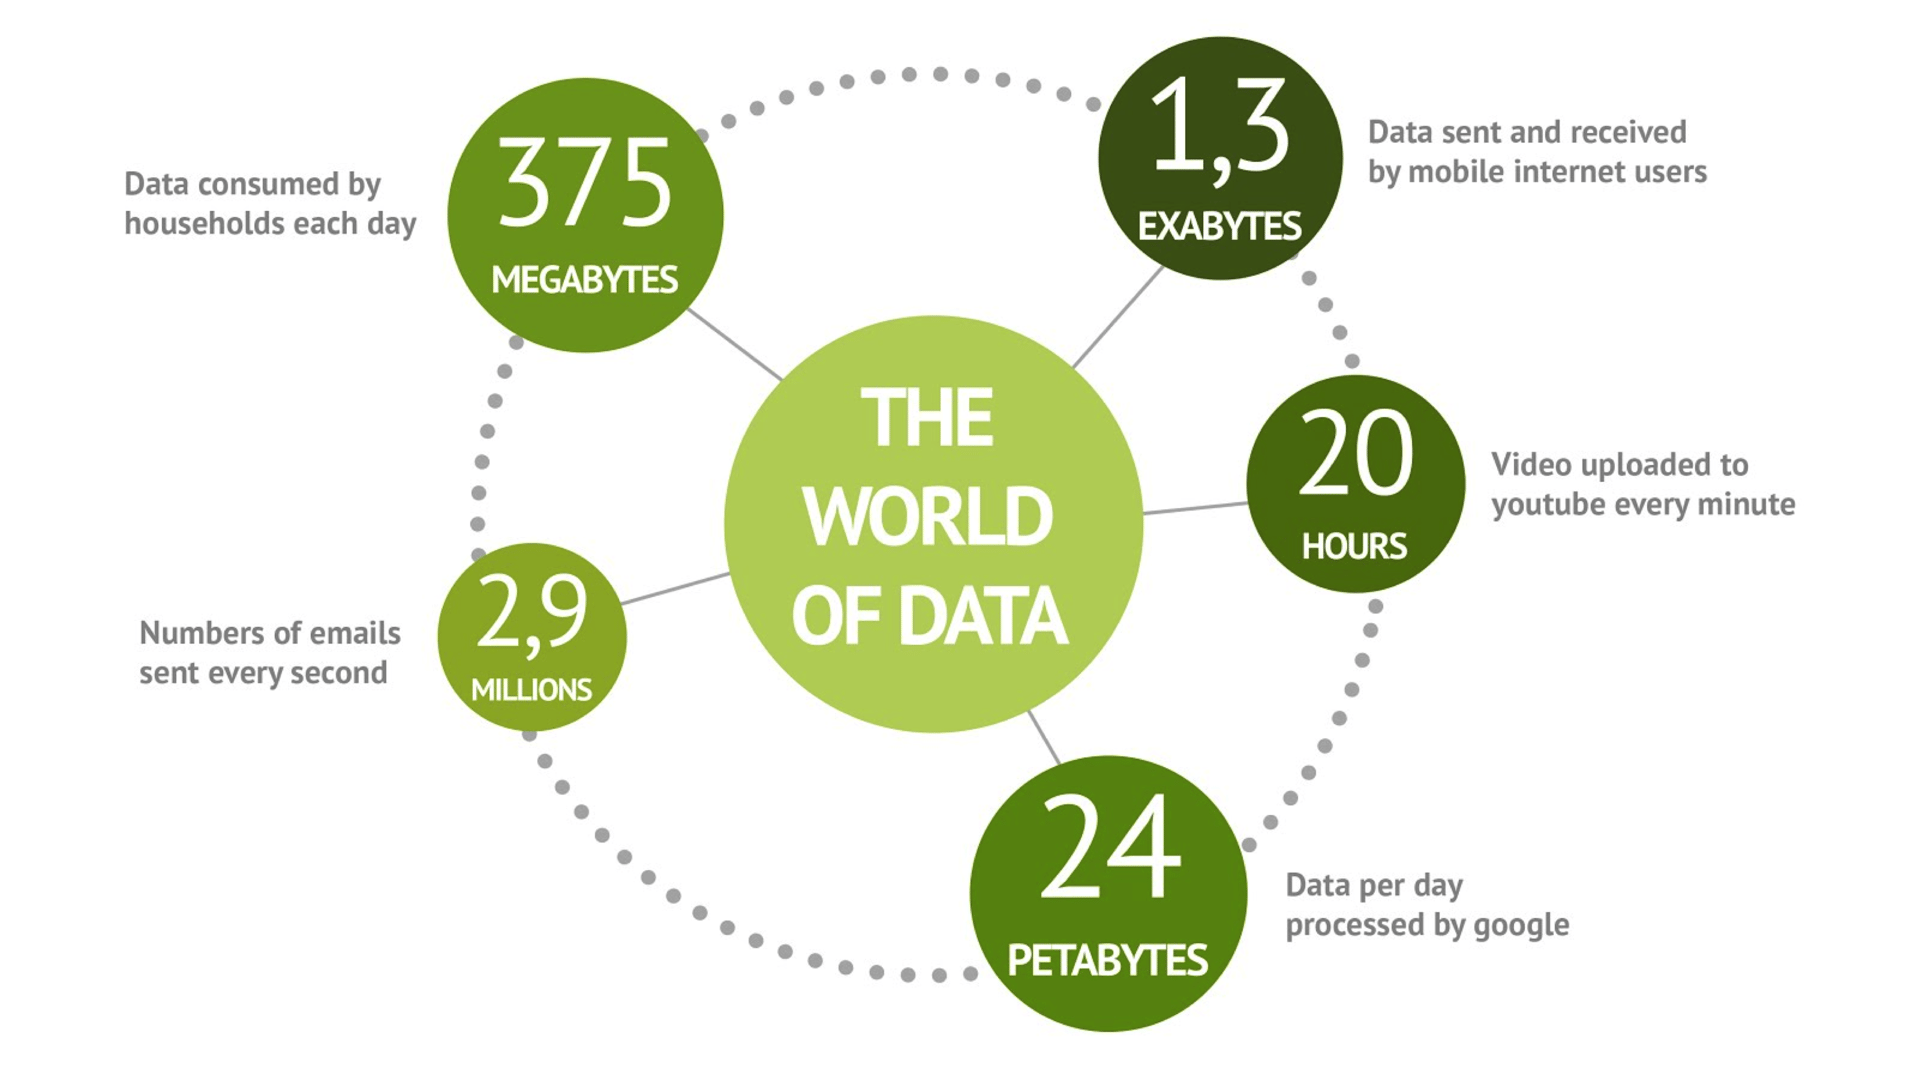
Data is all around us
Mobile phones, tablets and laptops are connected to the company’s servers and whenever someone is surfing the web, sending emails or using applications, information is generated, This vast amount of “hidden” information holds actionable intelligence waiting to be revealed, but unfortunately most of it is unstructured. This makes it harder to discover useful information among all the data. Some companies turn to big data tools to crunch numbers, but resources are limited. Those who are familiar with log management solutions, create in-house scripts to get the job done. This situation translates into a lot of effort on limited resources so you need to find an easier way to summarize all of your information to find the valuable insights to make a positive impact on your business.
How to bring your data to life
Understanding your data is the most important thing. You can have tons of useful data but without the right tools it is worthless. Data representations can help you understand relations between variables when an error or event happens. This is very important because you may want to know how similar events have occurred or categorize them. When you are diagnosing a problem, it’s helpful to have a visual representation of the data to spot trends instead of scanning millions of rows on a table. Also, it’s important the way in which the data is represented. Depending on the nature of the data, there are many ways to present the data in a visual form.
Graphs can give you X-ray vision
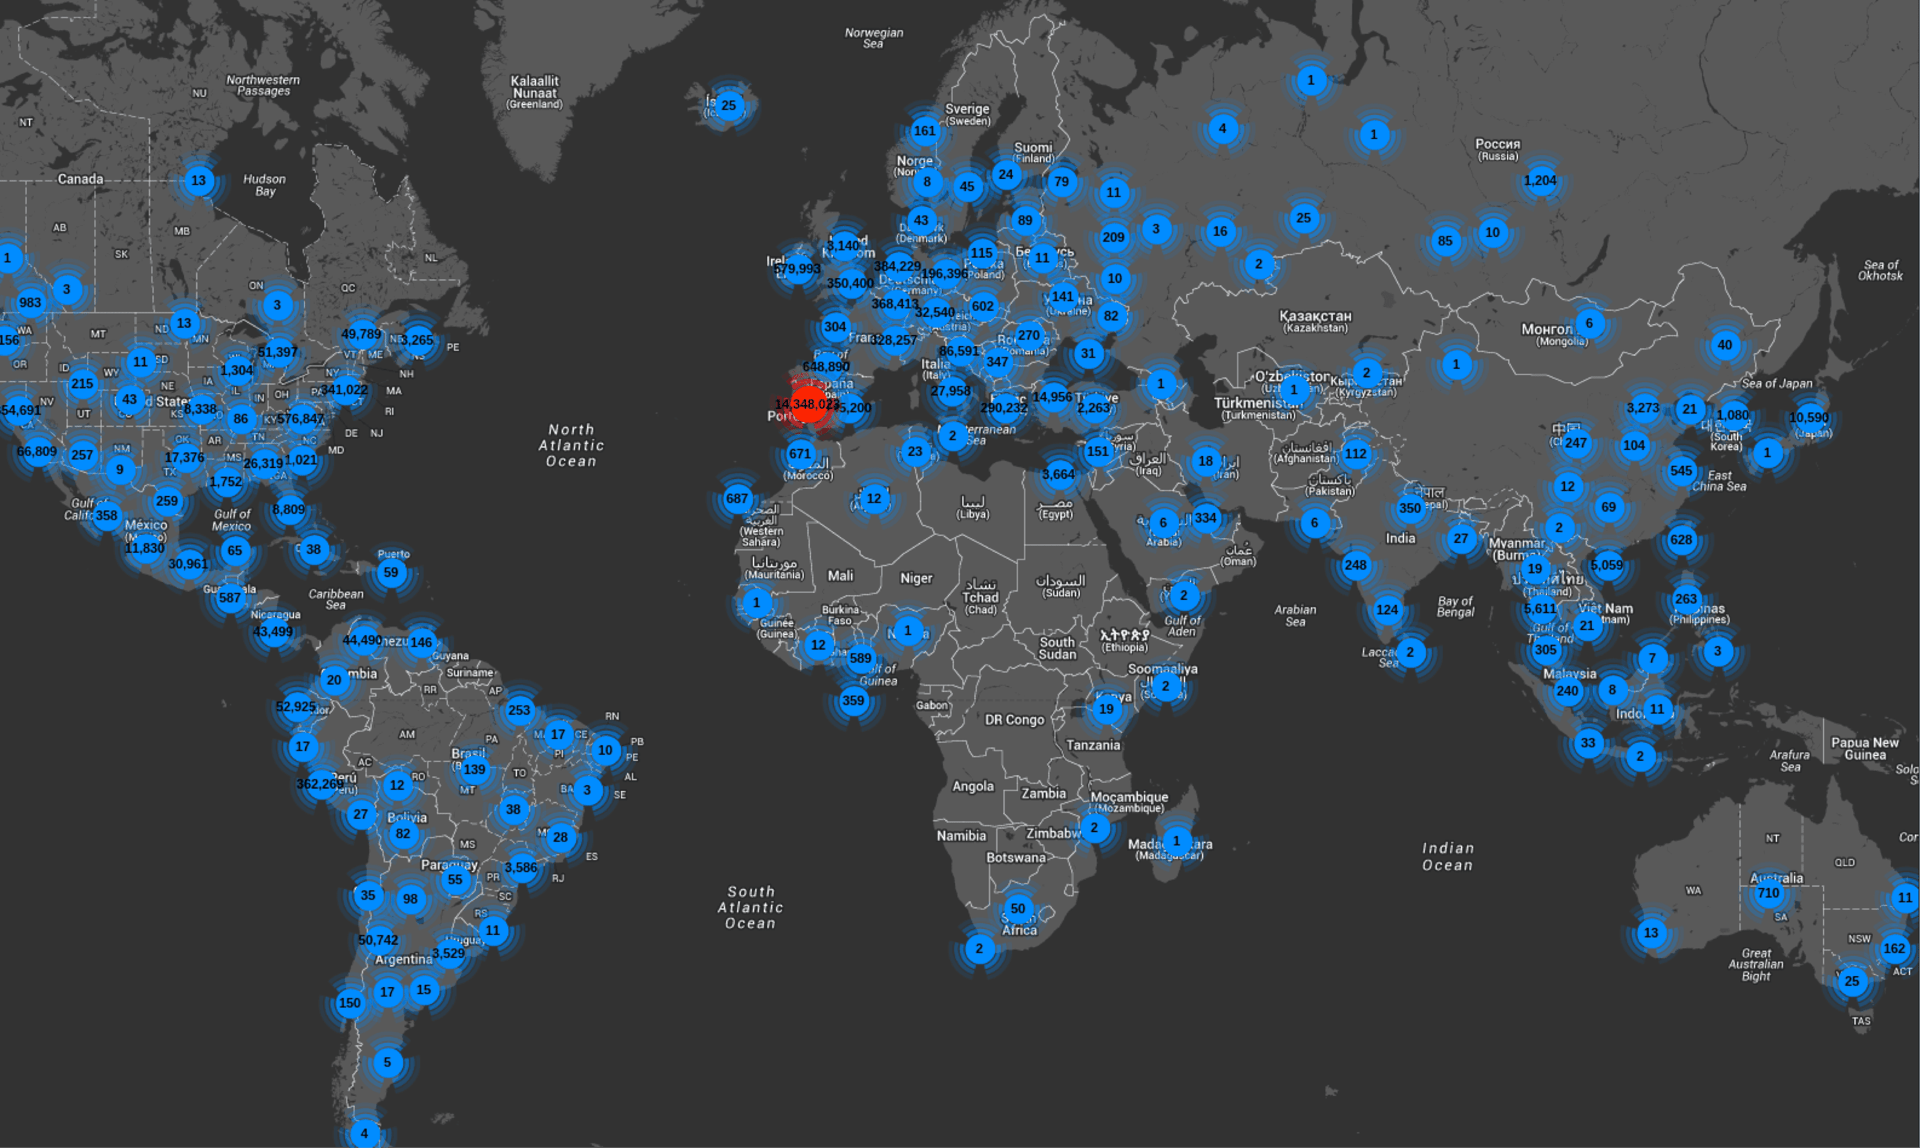
Some of us are visual learners so graphs can be a good way for us to quickly highlight hotspot areas. Imagine we have a website and we want to know when the service is not working properly. First, we should look at how many requests we are dispatching, and how many of them have errors. Using a map can help discover if we have problems in a specific country or worldwide. Below, for example, is a request distribution map:
Another way you can see the same information in another kind of visual representation are voronoi charts:
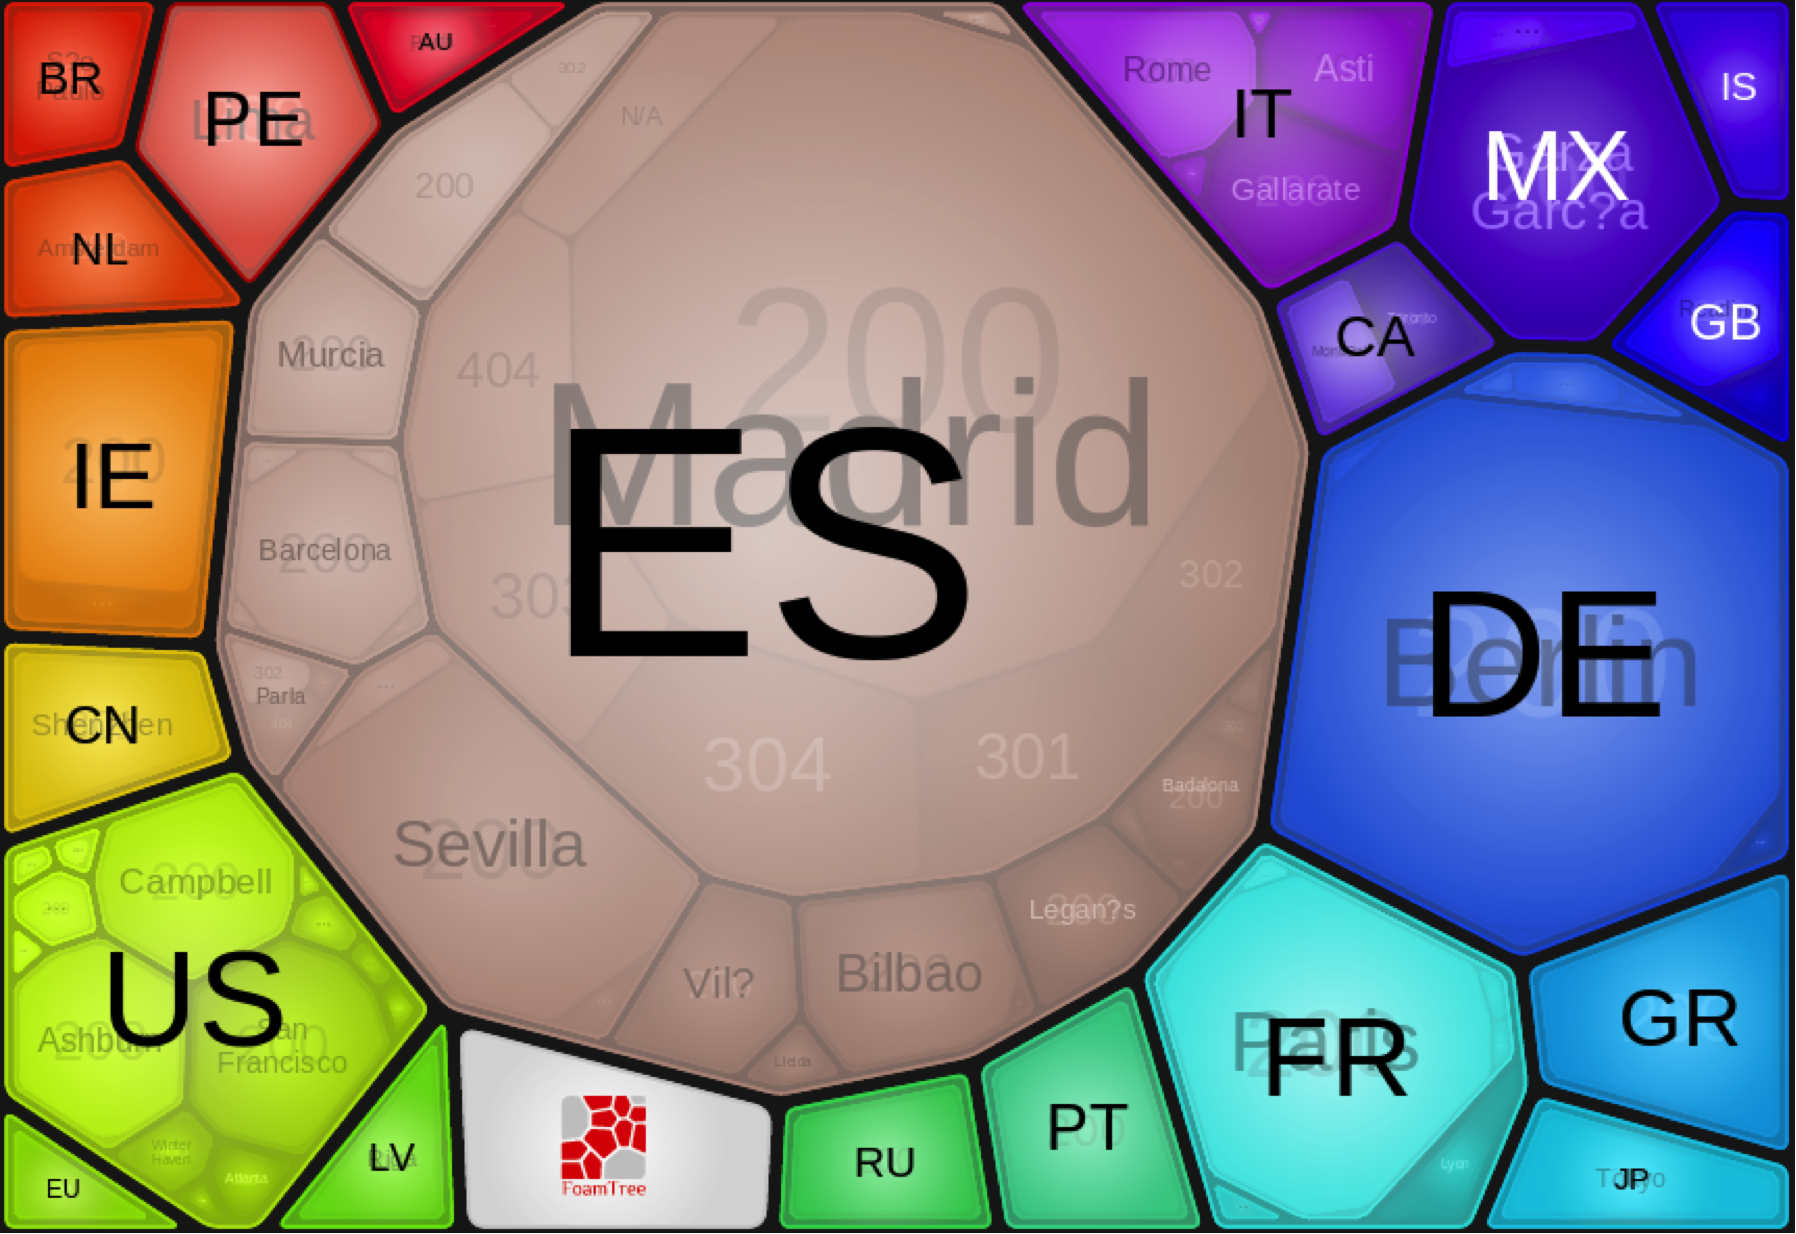
Since Spain is the problem area, we can drill down one level deeper to see which parts of Spain has errors. A visualization of errors by city can give you further insight around where problem areas are. To contrast, how does this error distribution compare to the rest of the world world?
The more requests a country sends, the more likely it is a source of errors but let’s assume that our problem is not affecting just a country but all over the world. Graphs can contain the error distribution map of a given day, but in the graph below we can take a closer to at the last hour to see if the problem follows the same distribution.
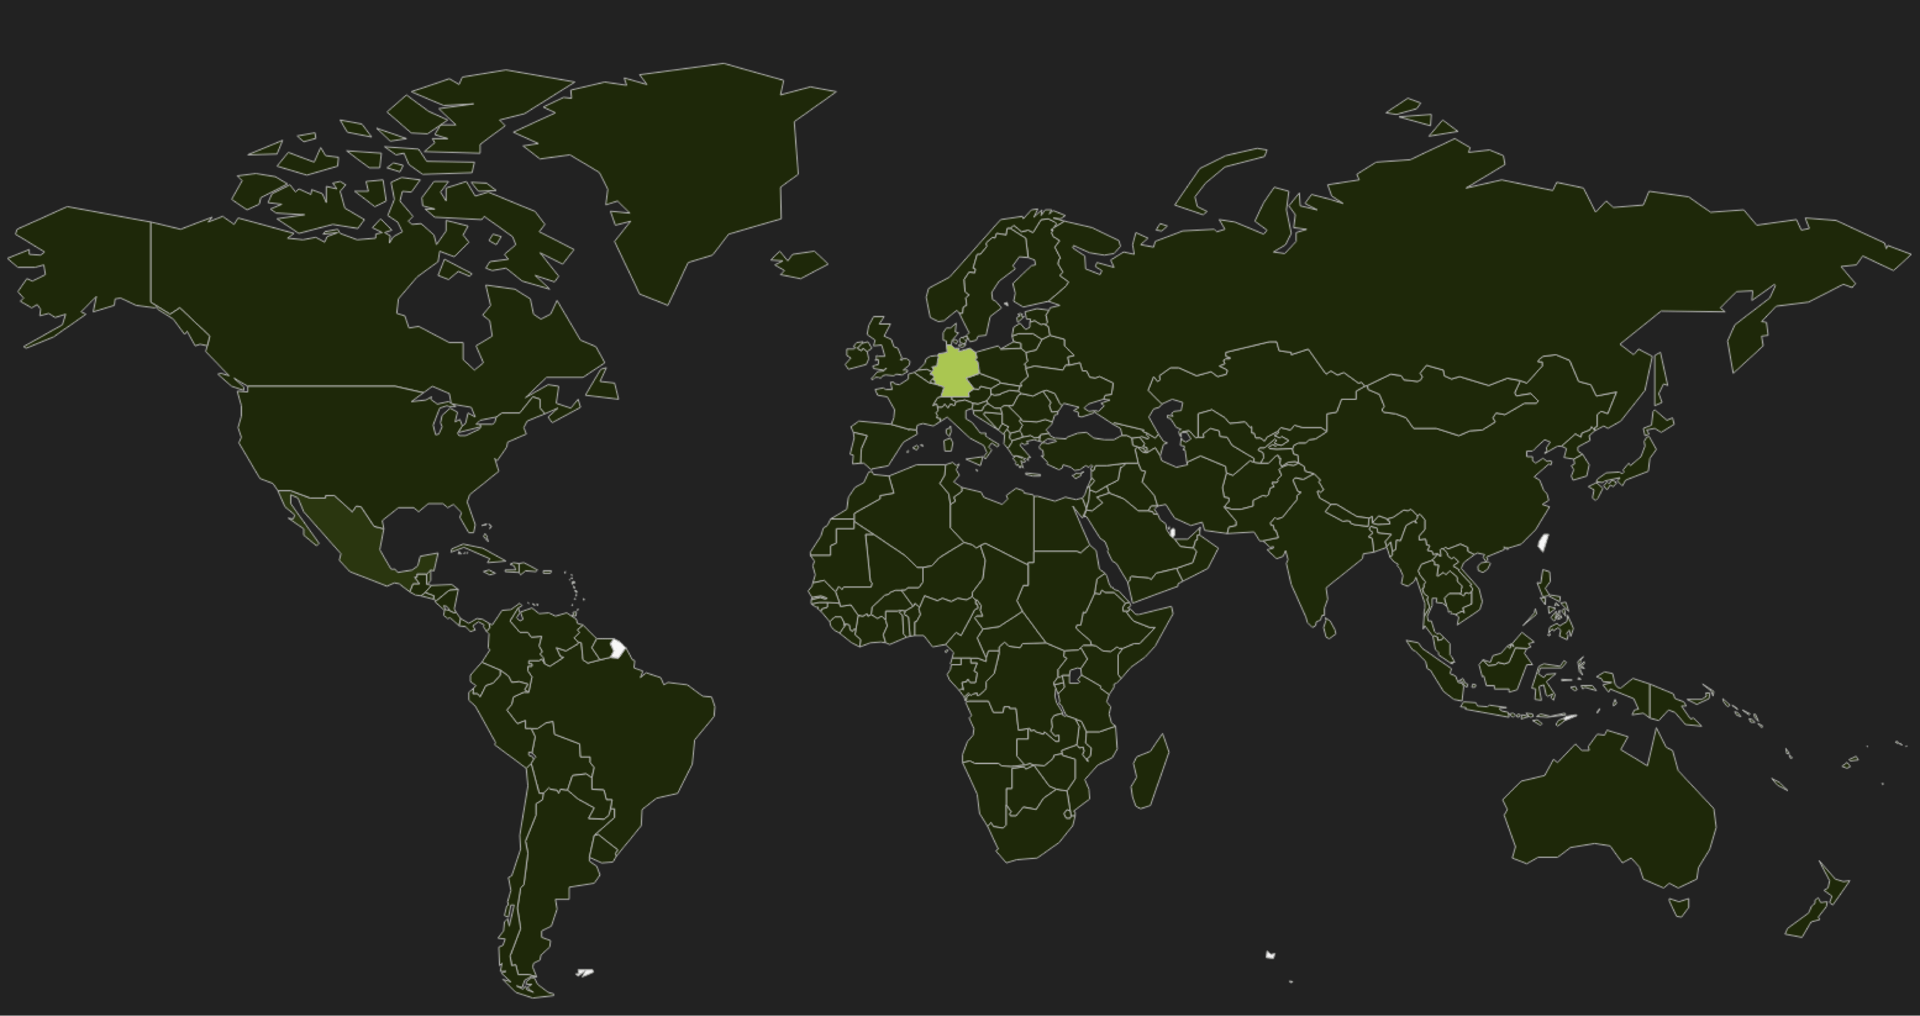
The error distribution map for the last hour is focused in Germany. These stats could lead us to detect system anomalies. If we see the server stats we can see where the errors are coming from.
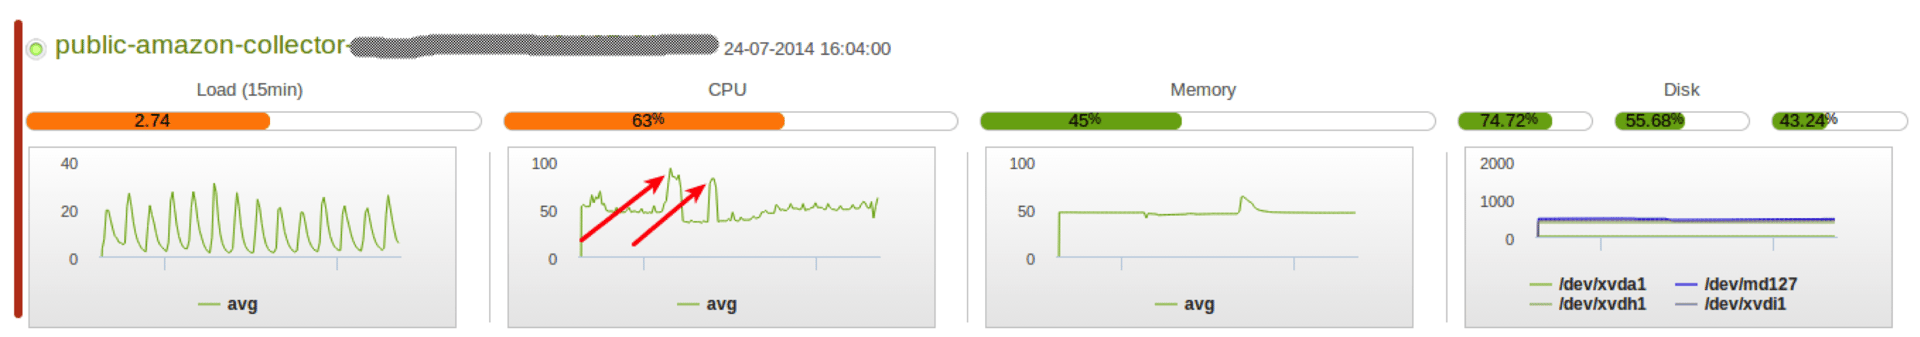
With the dashboard above, we can see our server had a CPU overload because of system maintenance routines. If this CPU overload starts impacting your customers, you’ll need to notify your on-call engineer to resolve these issues. Get more value from your data by integrating PagerDuty and Logtrust today.