Related Integrations
APM - Observability
- Elastic AI Assistant
- Dynatrace Workflows
- LangSmith
- Simple Observability
- ThirdEye
- Edge Delta
- Dash0
- Metoro
- DBmarlin
- Robusta
- IBM Instana Observability
- APImetrics
- Sensu
- Datadog
- Nvadr
- Uptycs
- SigNoz
- Blackfire.io
- Lightup
- Last9
- Observe
- Chronosphere
- Sedai
- Reveille
- Scout APM
- SnappyFlow
- eG Enterprise
- Heal
- Honeycomb
- LogRocket
- CloudQA
- Tideways
- Kentik
- AppViewX
- Plumbr
- Harness
- Templarbit
- IOpipe
- ITRS Geneos
- Oracle Developer Cloud Service
- Expel
- VMware Aria Operations for Applications
- Ixia Hawkeye
- Bitbar
- V6Sonar
- Logz-io
- Poweradmin
- Atatus
- FusionReactor Cloud
- Datadog Add-on
- OverOps | Takipi
- ServiceNow Cloud Observability
- IBM Instana Observability
- Uptrends
- Raygun
- Quest Spotlight Enterprise
- Soasta
- Dynatrace
- NS1
- CloudWisdom
- Incapsula
- WhatsUp Gold
- Dynatrace AppMon
- Sematext
- Microsoft Azure Alerts
- Errorception
- Stathat
- Steward
- Monitis
- HP SiteScope
- Apteligent
- Pandora FMS
- Quest Foglight
- AppFirst
- Pulseway
- Amazon CloudWatch
- ScienceLogic
- New Relic
- Neustar
- AppDynamics
Contents
Amazon Web Services CloudWatch provides monitoring for AWS resources and customer-run applications. AWS can collect data, gain insight, and alert users to fix problems within applications and organizations. AWS CloudWatch gives system-wide visibility into resource utilization and notifications can be set for when any metrics cross a specified threshold. These alarms can be automatically sent to PagerDuty, which then reliably alerts the correct on-call person through their preferred contact methods.
Follow the instructions below to configure your AWS Cloudwatch with PagerDuty. If you have any questions or need any assistance, please contact our support team at support@pagerduty.com.
Note: Alarms from CloudSearch, DynamoDB, EBS, EC2, ECS, ElastiCache, ELB, ES, Kinesis, Lambda, ML, Redshift, RDS, SNS, SQS, S3, SWF, StorageGateway, and WAF are supported. Alarms from Route53 and custom metrics will create incidents however, they will not be as detailed. Autoscaling messages are not currently supported. For more custom need, you can integrate using an email integration
In PagerDuty
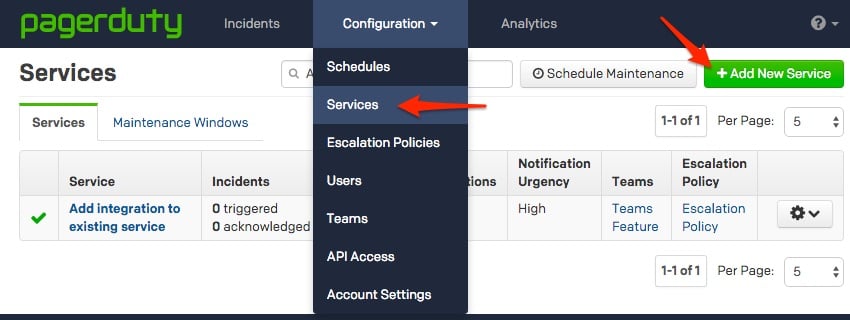
- From the Configuration menu, select Services.
- On your Services page:If you are creating a new service for your integration, click +Add New Service.
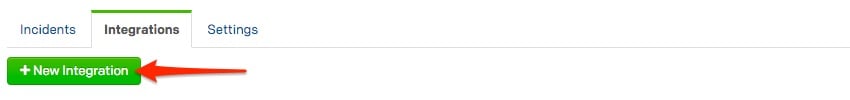
If you are adding your integration to an existing service, click the name of the service you want to add the integration to. Then click the Integrations tab and click the +New Integration button.
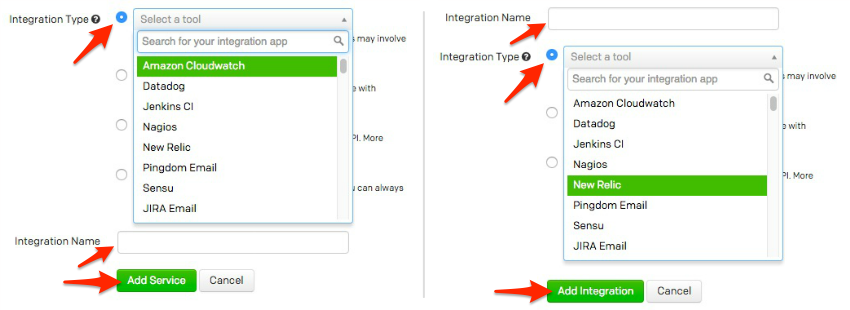
- Select your app from the Integration Type menu and enter an Integration Name.
If you are creating a new service for your integration, in General Settings, enter a Name for your new service. Then, in Incident Settings, specify the Escalation Policy, Notification Urgency, and Incident Behavior for your new service.
- Click the Add Service or Add Integration button to save your new integration. You will be redirected to the Integrations page for your service.
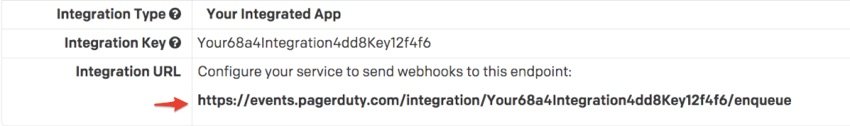
- Copy the Integration URL for your new integration.
In the AWS SNS Console
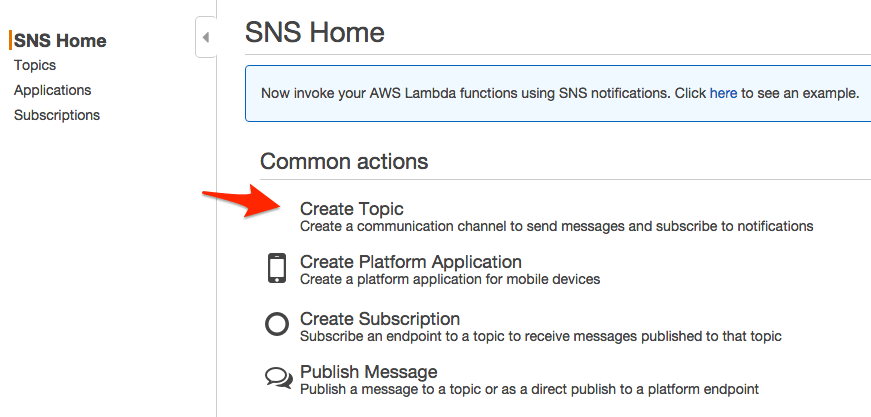
- In the SNS Console, click Create Topic.
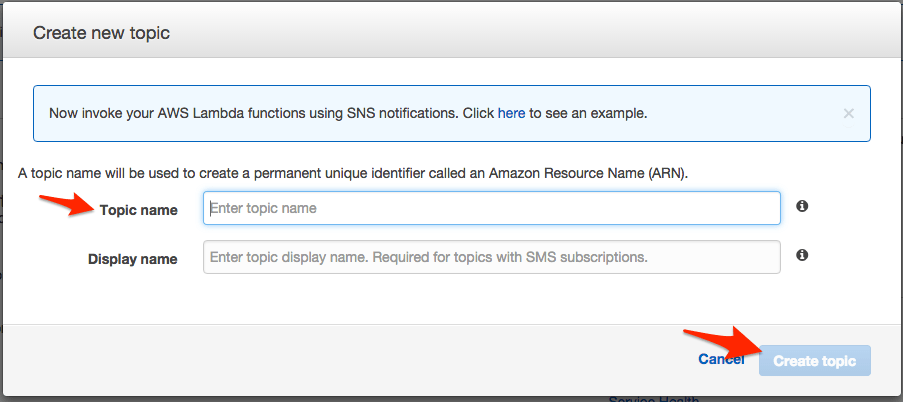
- Enter a Topic name and Display name, then click Create topic. You may want to name your topic after your PagerDuty service’s name.
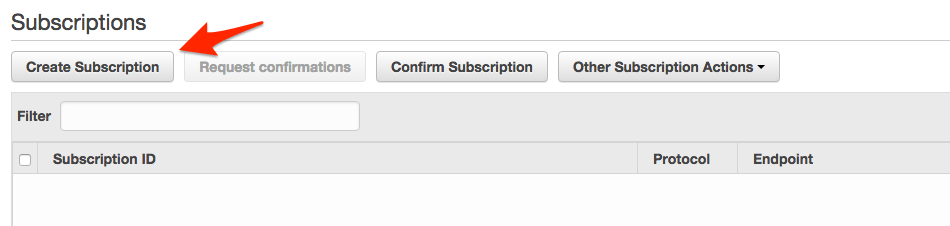
- Now that your topic has been created, click Create Subscription.
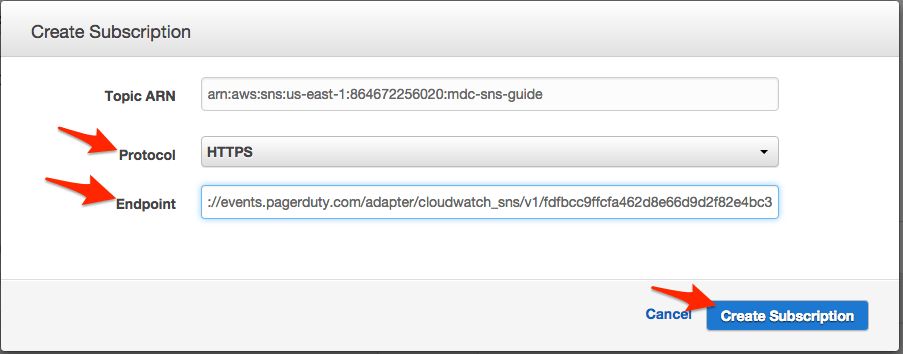
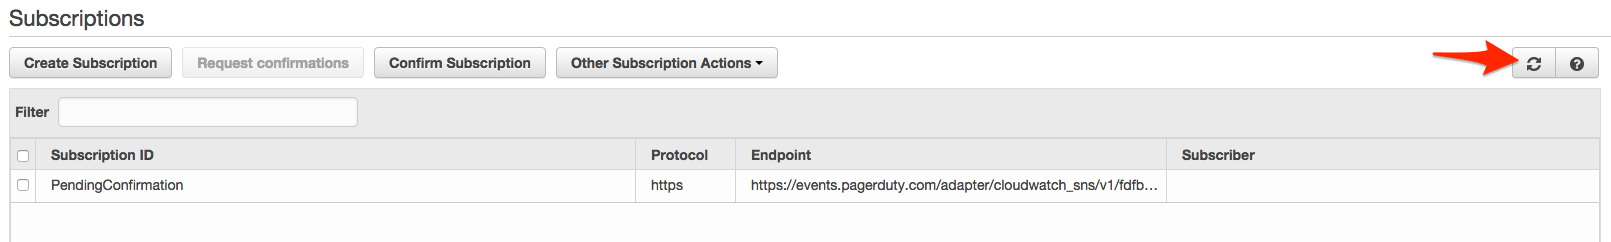
- Make sure HTTPS is the selected Protocol. Paste your SNS Webhook URL from step 3 (above) into the Endpoint field and click Create Subscription.
- Your subscription should be automatically confirmed. Click the refresh icon to make sure the Subscription ID is not PendingConfirmation.
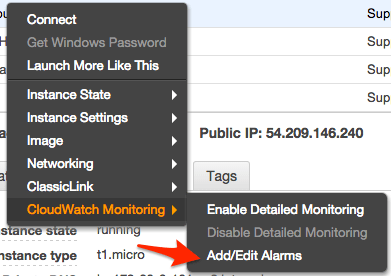
- Go to your EC2 Instances Console. Right click on the instance that you would like to monitor, and select Add/Edit Alarms.
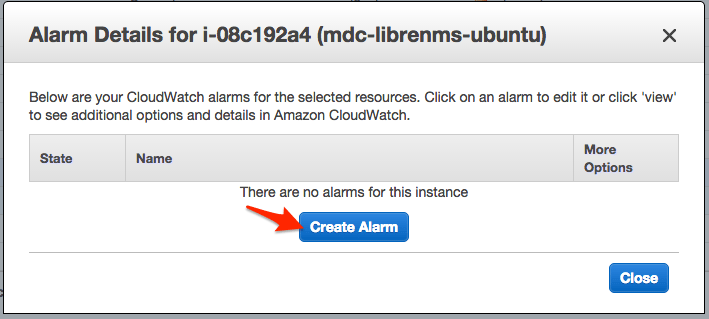
- Click Create Alarm.
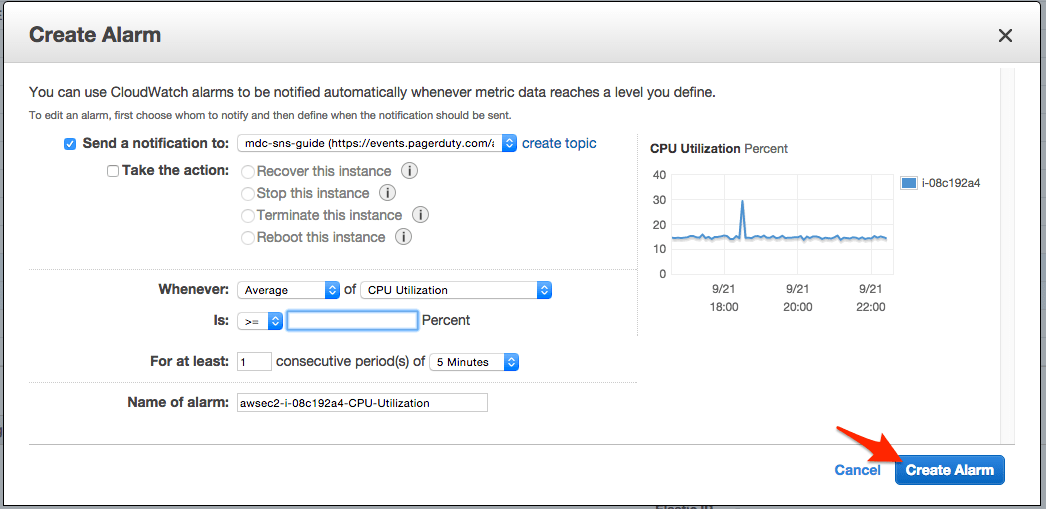
- Select your notification from the dropdown menu, configure the settings that you would like to use for the alarm, and click Create.
- At this point, you will receive alerts in PagerDuty for when an alarm has reported a critical alert, but the PagerDuty incident will not be resolved when the alarm clears. To enable automatic resolution in PagerDuty when an alarm clears, right click on your instance and select Add/Edit Alarms again.

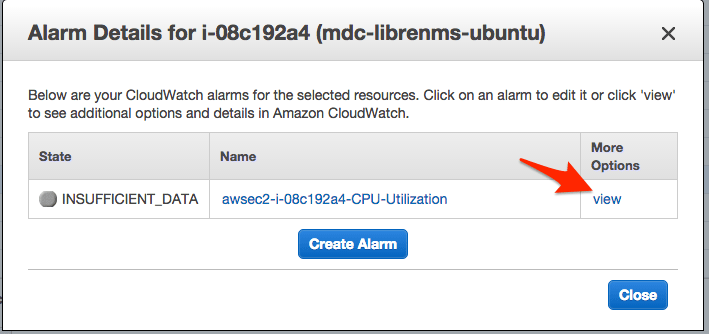
- You will see the alarm that you created earlier. Click view under More Options.
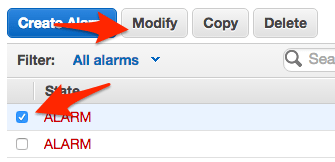
- Select your alarm, then click Modify.
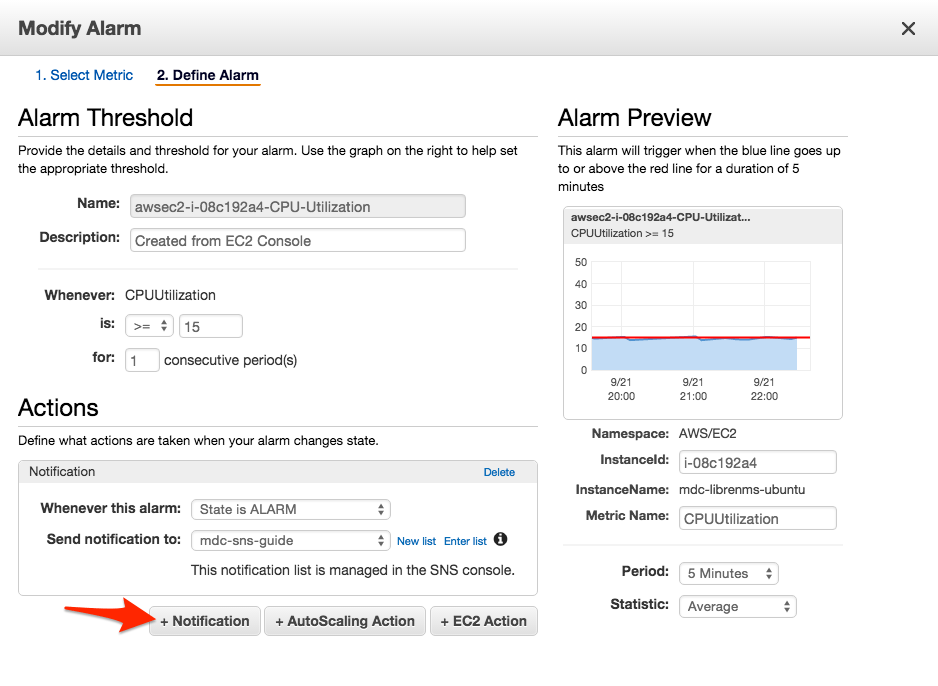
- On the Modify Alarm screen, verify your alarm threshold and settings. Add a new Action to Send Notification(s) when the alarm state reaches ALARM, by clicking + Notification.
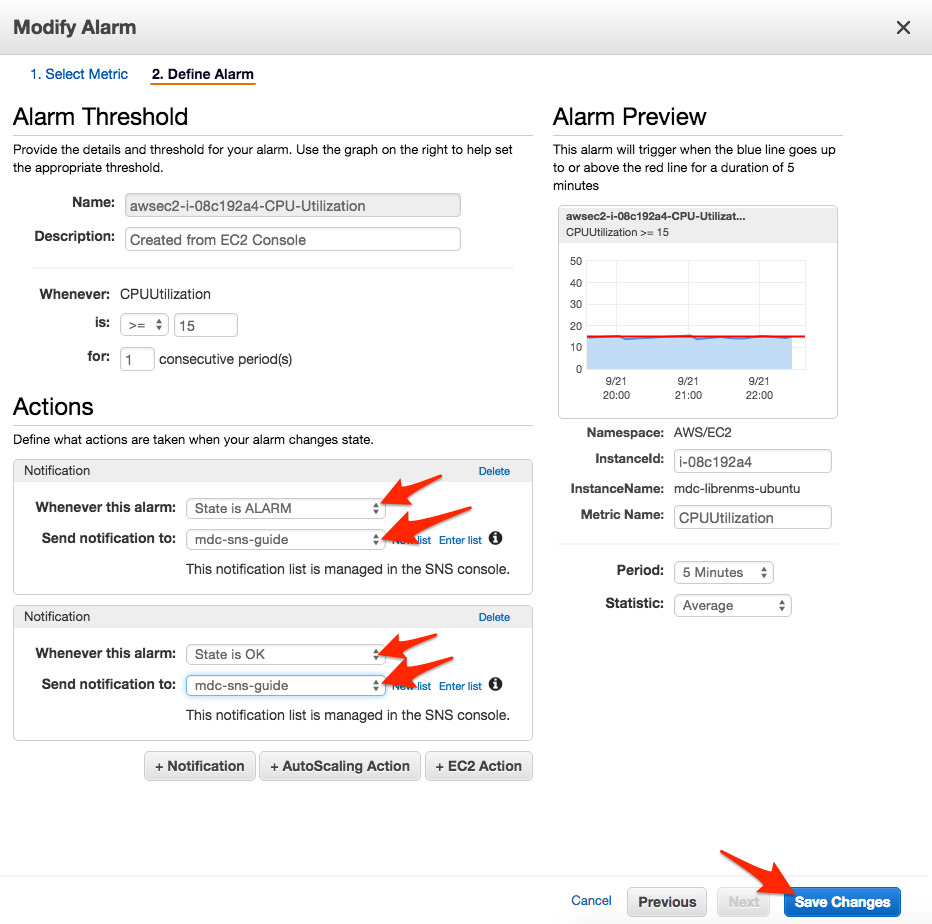
- You’ll want to add a notification for the OK state and check that your ALARM state notification is correct. Make sure to save your changes.
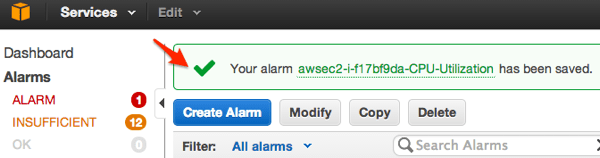
- You should then see that your Alarm was saved successfully.
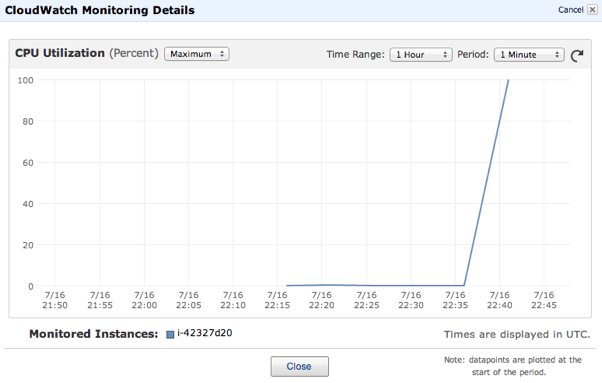
- Congratulations! You have now integrated Amazon CloudWatch with PagerDuty! Now when your alarm threshold is met, an incident will be triggered within PagerDuty.
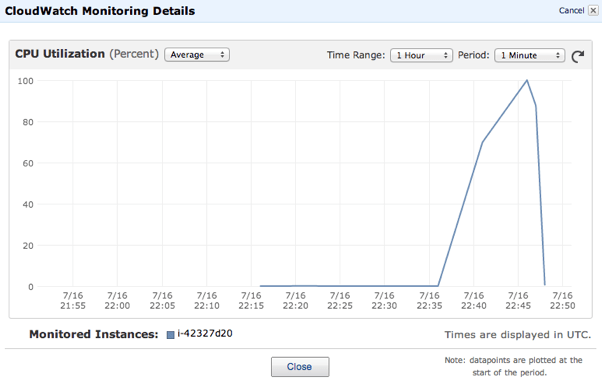
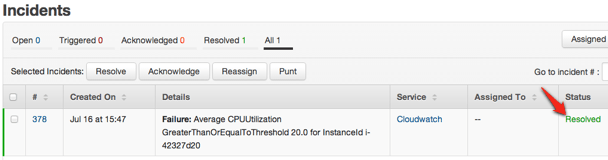
- Once that alarm is back in an OK state, the incident will automatically resolve within PagerDuty.
FAQ
What type of CloudWatch alerts are supported?
Alarms from CloudSearch, DynamoDB, EBS, EC2, ECS, ElastiCache, ELB, ES, Kinesis, Lambda, ML, Redshift, RDS, SNS, SQS, S3, SWF, StorageGateway, and WAF are supported. Alarms from Route53 and custom metrics will create incidents however, they will not be as detailed. Autoscaling messages are not currently supported.
What alarm statuses affect PagerDuty incidents?
An alarm with status ALARM will trigger incidents, and status OK will resolve them. Alarms with status INSUFFICIENT_DATA will not affect a PagerDuty incident. If you need INSUFFICIENT_DATA to resolve an incident, we recommend using an email integration instead.
If I use an email integration, how can I verify my PagerDuty service’s email address?
If you send a confirmation email to your service’s PagerDuty address, you will be able to view the message body and verify that address from the PagerDuty console. To do so, find the incident that is created by the email and view its details to verify the email address.
The link to verify will be in the incident details. The SNS confirmation page requires JavaScript, which can not be executed in the iframe the message is rendered in. To confirm your subscription, open the confirmation link in a new tab or window by right-clicking on the link and choosing Open Link in New Tab/Window.